Cash Coverage Ratio in Commercial Lending
How a property's cash income stacks against what it owes in debt.

Looking at this text, I need to identify one-liners, puns, jokes, anecdotes, metaphors, and similes, then limit each category to one instance total.
Metaphors/similes found: "sitting on top of some genuinely messy inputs," "hangs off that single question," "trips people up," "runs a deficit," "underwater," "wall of maturities" (x2), "coverage cliff," "born into," "grunt work," "flatter the numbers," "leading indicator," "full stop," "same road," "call first"
Anecdote-like aside: "sometimes a scanned document that looks like it came off a fax machine from 2004"
I'll keep one strong metaphor (the "wall of maturities") and trim the rest to plain language.
DSCR, debt service coverage ratio, answers one question for a commercial real estate lender: will this property's income cover what it owes. Thresholds, covenant monitoring, the software that now automates spreading, all of it depends on that single question. The ratio itself is simple math built on some genuinely messy inputs, and the gap between the formula and the reality feeding it is most of the story here.
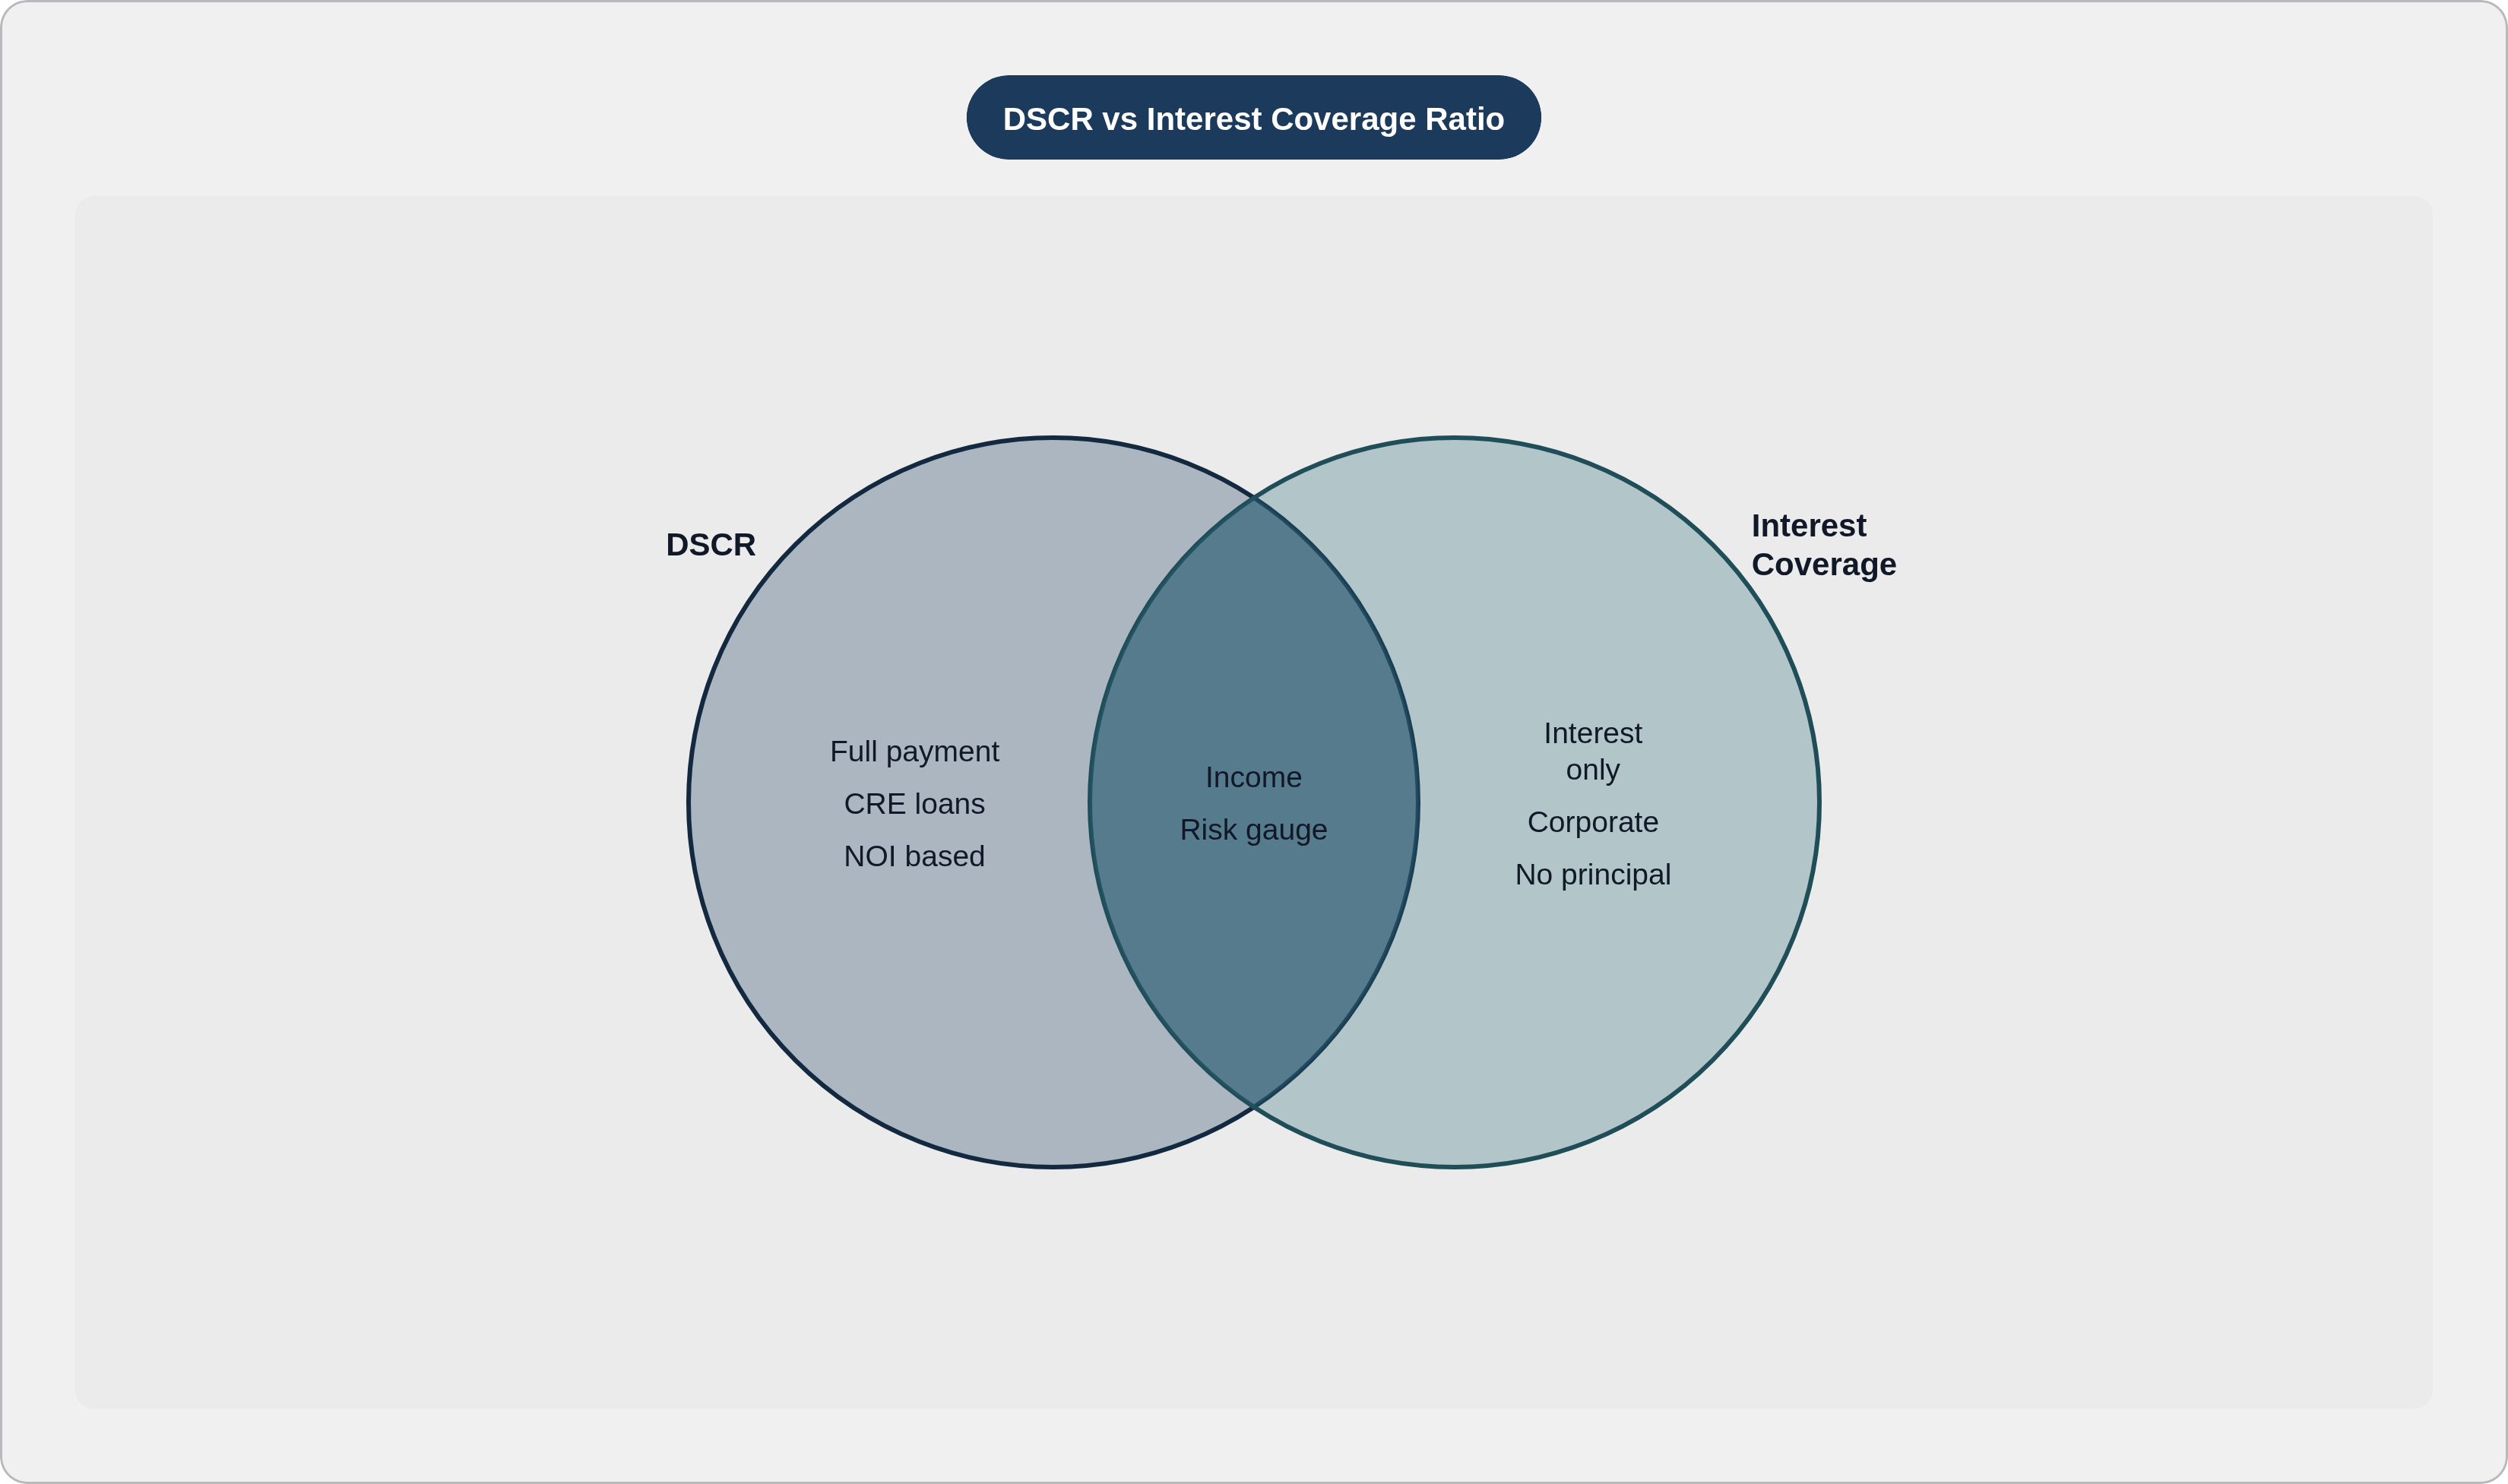
The formula isn't complicated. It comes down to NOI divided by annual debt service, meaning principal plus interest together, not interest alone. That last part causes confusion more than it should. Corporate finance folks lean on interest coverage ratio, which strips out principal and only checks whether a company can cover its interest cost. CRE lenders use a fuller measure, because a mortgage isn't interest-only in most cases, and the borrower has to make the whole payment regardless of what's happening to rates or vacancy that quarter. Interest coverage tells you if a company can afford the carrying cost. DSCR tells you whether a property brings in enough cash to make its full, contractual payment, on time, month after month.
So when a lender says a loan needs 1.25x DSCR, they mean: for every dollar owed, the property needs to bring in more than a dollar for every dollar owed. Below 1.0x, the property runs a deficit and somebody covers the gap out of pocket, usually the sponsor, while at 1.0x you're break-even, and above that you've got a buffer against a bad month, a bad tenant, or a genuinely bad year.
Keep this separate from loan-to-value. People mix the two up constantly, and they measure completely different things. LTV asks how much equity sits behind the loan if the property has to be sold, while DSCR asks whether income can service the debt while things are running normally, day to day, tenant by tenant. A property can carry a moderate LTV, plenty of equity cushion on paper, and still fail a DSCR test if the operations underneath are weak. Low leverage doesn't fix bad cash flow, and that's exactly why lenders check both ratios instead of picking a favorite and calling it a day.
How DSCR is calculated and where the inputs can mislead
The arithmetic, in practice: NOI meaningfully above debt service gets you 1.25x in this example, and that property could absorb a significant drop in NOI and still hold above the 1.0x line. The inputs feeding that simple math are where things get slippery.
Most of the real work happens in the NOI line, built from several pieces stacked on top of each other. Start with gross potential rent, subtract vacancy and credit loss, add back other income (parking, laundry, whatever ancillary revenue the property throws off), then subtract operating expenses: taxes, insurance, maintenance, management fees. Then there's the reserve question. Some lenders deduct replacement reserves before calculating NOI; others skip it entirely, and that inconsistency alone creates comparability problems, since two lenders looking at the identical property can land on two different DSCR figures depending on how conservative their reserve treatment happens to be.
The debt service side has its own quirks, and this is the part that actually causes trouble. Loan amount, interest rate, amortization schedule are all straightforward on paper. But rate changes alter the denominator without the property's performance moving at all. A loan comfortably above threshold at lower rates can fall below 1.0x at significantly higher rates with the same NOI and the same tenants. Nothing about the building changed; the lending environment shifted underneath it, which means DSCR is really a function of the asset and the rate environment together. Read one without the other and you've learned next to nothing.
Then there are the games, and they happen more than lenders like to admit out loud. Borrowers sometimes hand over "pro forma" NOI, a projection dressed up as a fact, instead of trailing twelve months of actual performance, some underwrite a below-market management fee to inflate NOI, since a below-market fee looks a lot better on the expense line than a market-rate one, and others exclude vacancy on a lease-up asset without building in a realistic stabilization timeline, effectively assuming leasing performance well above what the market supports.
A useful check against all this is debt yield: NOI divided by loan amount, nothing else, no rate or amortization anywhere in the formula. It's harder to game by restructuring loan terms, because it doesn't care what the terms are. That's why it keeps showing up in covenant packages next to DSCR now, two ratios offering two angles on the same risk, harder to fool both at once.
The thresholds lenders actually use and what they signal about risk appetite
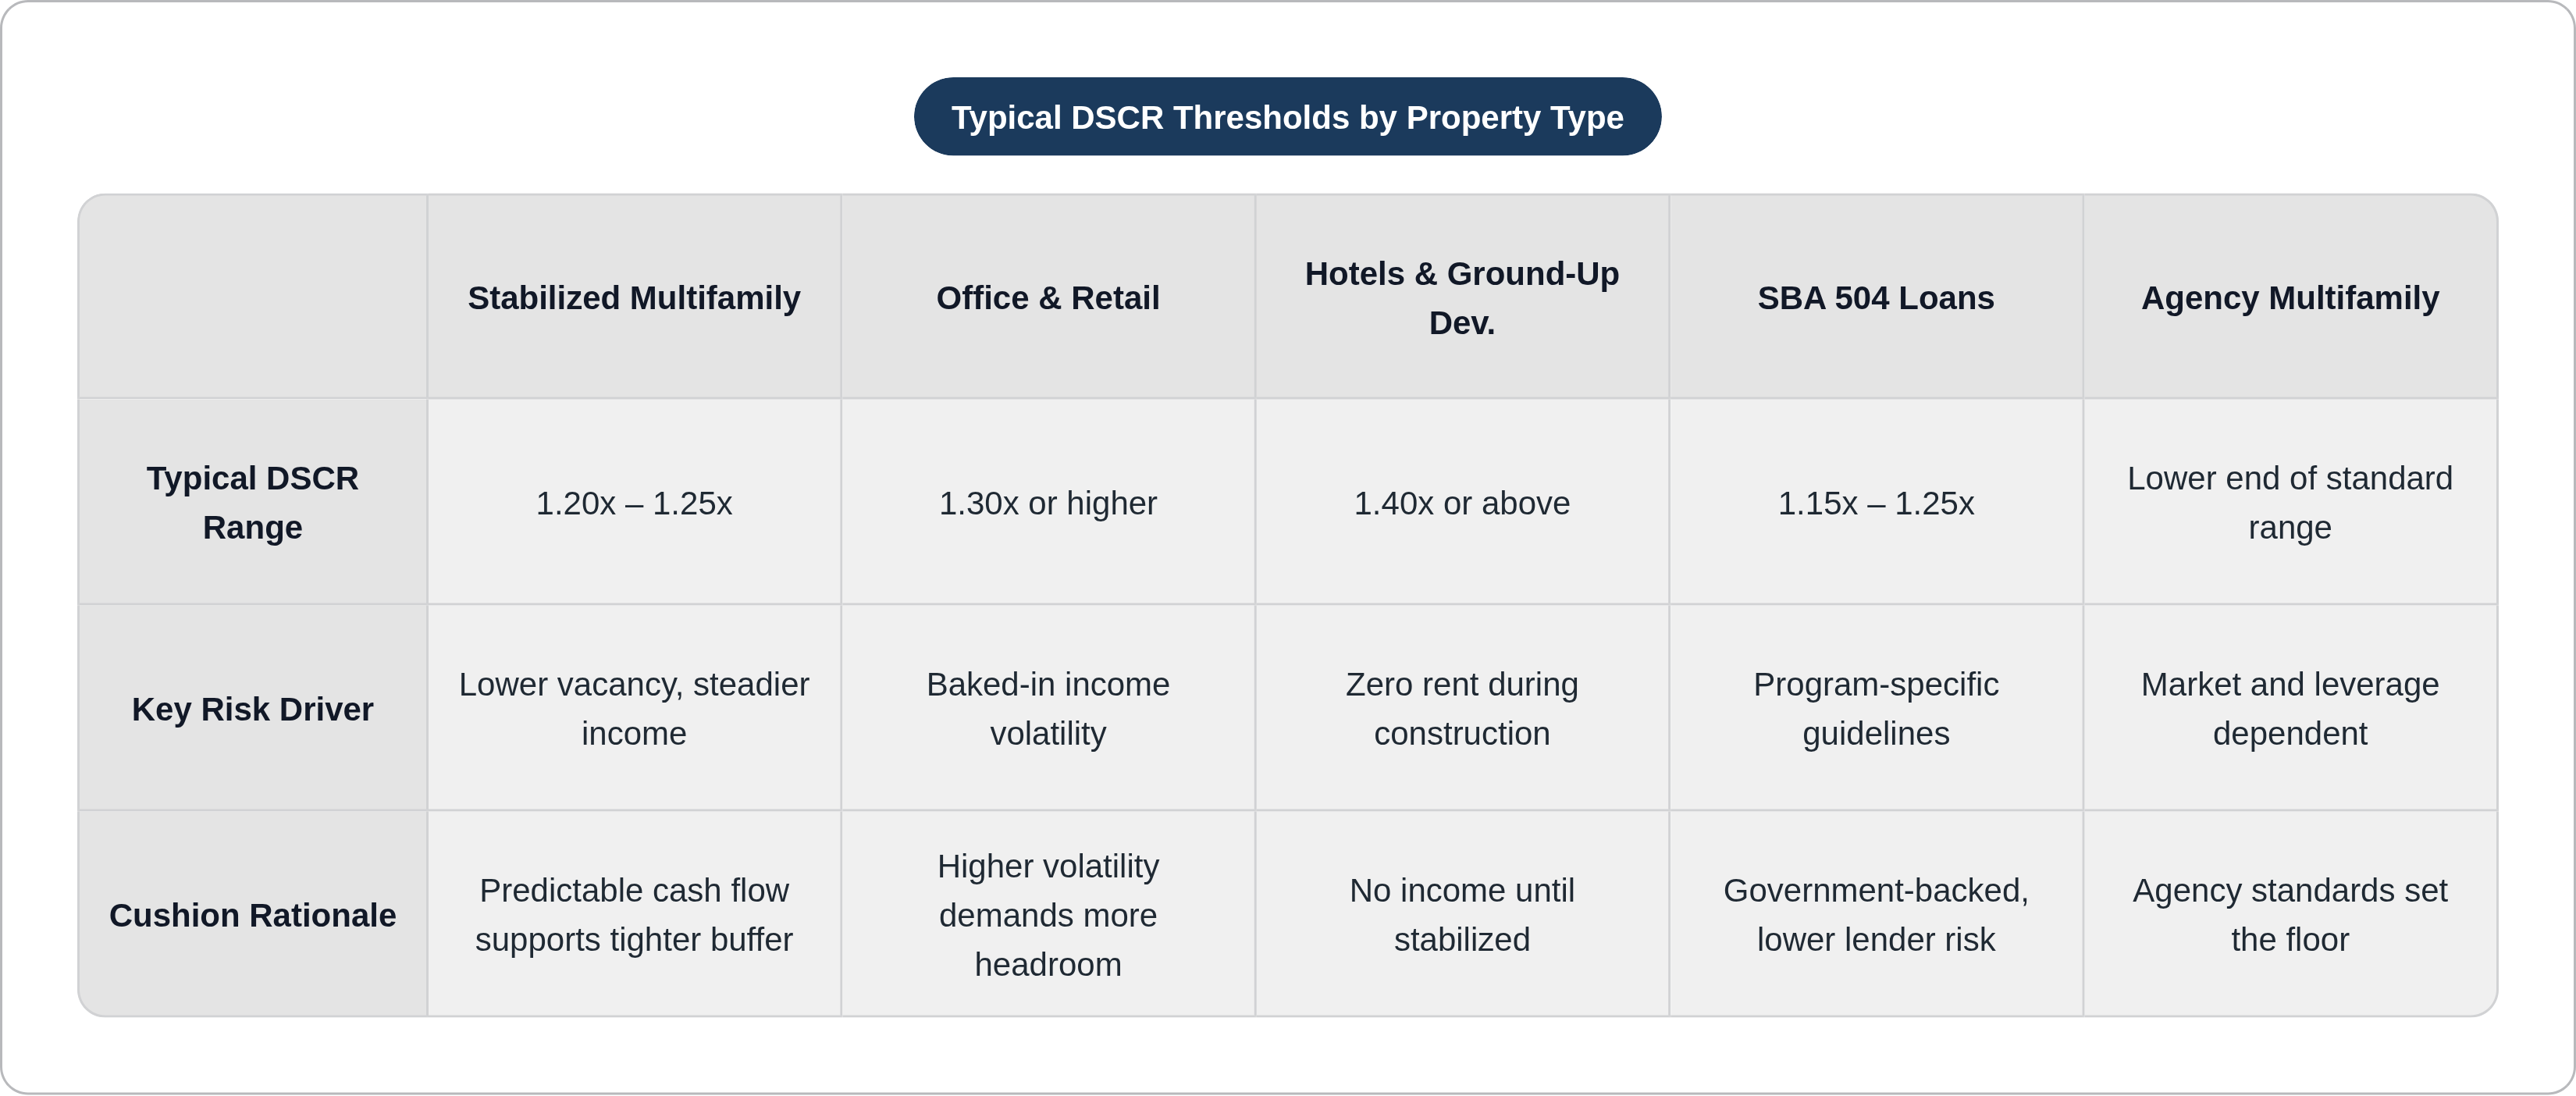
Most U.S. commercial real estate lenders want 1.20x to 1.35x at origination for a stabilized property. That's the baseline, and it moves depending on what kind of asset is sitting across the table from the underwriter.
Stabilized multifamily tends to land at the low end, around 1.20x to 1.25x, because income is steadier and vacancy risk runs lower. Office and retail, along with anything tagged value-add, usually get pushed to 1.30x or higher, since income volatility is baked into those property types in a way it isn't for a well-leased apartment building. Hotels and ground-up development can climb to 1.40x or above, reflecting the simple fact that a half-built building generates zero rent, unlike a signed twelve-month lease. SBA 504 loans sit around 1.15x to 1.25x depending on the lender, and agency multifamily loans typically sit toward the lower end of the standard range depending on market and leverage.
What does the cushion actually buy? A 1.20x requirement means NOI could drop by roughly one-sixth before the property stops covering debt service, and that's the margin of safety a lender buys with that number, not a figure pulled out of thin air.
Averages hide more than they reveal here, though. Corebridge Financial reported a weighted average DSCR of 1.9x across its CRE mortgage portfolio at year-end 2025, a conservatively underwritten book by any measure. Voya Financial's CRE mortgage portfolio at year-end 2024 told a different story: $398 million in loans below 1.0x DSCR, and another $615 million sitting in the 1.0x to 1.25x band. That's real exposure sitting at or below what most lenders wouldn't even accept at origination.
The gap between those two portfolios shows how differently institutions carry coverage risk on their books. A stated minimum at origination guarantees nothing about where a loan sits three or five years later. Threshold floors tell you about underwriting discipline at the moment of closing. What happens after closing, which is most of the loan's life, is a separate question entirely.
Average LTVs across CRE lending sit around 63.3%, per CBRE, showing moderate leverage across the market broadly, but DSCR distributions that can vary wildly institution to institution. Read LTV and DSCR together, since neither one is the whole answer by itself.
Why the current rate and maturity environment puts cash coverage under pressure across portfolios
The 2022 to 2023 rate cycle put real strain on DSCR market-wide. Loans that cleared 1.25x when rates sat around 4% often can't clear 1.0x at 7%, with the same NOI feeding the numerator both times. The properties themselves held steady, while the financing environment moved, and it moved faster than most previous tightening cycles managed over a comparable stretch.
That timing problem is now colliding with a wall of maturities. Approximately $210 billion in CMBS loans matured between 2024 and 2025, and S&P Global Market Intelligence estimates CRE debt maturities climb to roughly $936 billion in 2026. Loans underwritten five, six, seven years ago at rock-bottom rates are hitting their maturity date and facing a refinancing market that looks nothing like the one that originated them.
Borrowers facing that wall have a few unpleasant choices, none of them free: inject fresh equity to shrink the loan balance and make the new DSCR test work, accept a higher coverage requirement at meaningfully lower proceeds than the original loan, or extend and hope rates come down before the next test date, which carries considerable risk if they don't.
CMBS delinquencies sat at 6.59% as of the third quarter of 2025, while bank and thrift delinquencies stayed much lower, around 1.27%. That gap tells you stress isn't spread evenly. It's concentrated in specific property types, office and retail chief among them, rather than showing up uniformly across every asset class. Add to that over 900 banks currently carrying CRE exposure well above their capital base, a concentration level drawing sharper regulatory attention to how these loans were underwritten in the first place.
For a lender managing a book of loans rather than a single deal, this maturity wave isn't a borrower's problem to solve alone. It's a portfolio-level event, and the lenders who come out ahead know which loans are approaching a coverage shortfall before the maturity date shows up on the calendar, not after.
How DSCR covenant monitoring works in an active loan portfolio
Loan agreements typically build in a minimum DSCR tested annually, or quarterly for riskier credits, with cure periods, cash management triggers, and default provisions tied to what happens on breach. Testing cadence varies by loan type. Testing cadence and trigger points vary by loan type and agreement terms, with permanent loans commonly tested against trailing twelve months of actual NOI. CMBS loans get tested at the servicer level, with their own cure periods and thresholds for kicking a loan into special servicing.
When a loan's DSCR slips into that uncomfortable 1.0x to 1.25x band, lenders have options short of calling a default, including more frequent borrower reporting and opening workout conversations before things get worse. The point is catching it early enough to still have options on the table, which sounds obvious until you look at how most shops are actually set up to catch anything at all.
Covenant testing only works if the underlying data is accurate and shows up on time. Rent rolls, income statements, expense schedules: these arrive from borrowers inconsistently, in different formats, sometimes a clean PDF, sometimes a scanned document of poor quality. Manual covenant tracking at any real scale creates lag almost by definition. By the time an analyst reconciles a borrower's annual financials by hand, the coverage picture may have already deteriorated further than what's sitting on the page in front of them.
That Voya figure, the $398 million below 1.0x, is worth a second look for a specific reason: it only became visible because it showed up in a 10-Q filing. Most lenders don't have that kind of visibility into their own book in anything close to real time. They find out at the annual review, or worse, at the maturity date. Active monitoring catches a breach early enough to negotiate a cure, while passive testing tends to find out once the loan's already in trouble.
Where manual spreading and document workflows create blind spots in coverage analysis
Financial spreading is the unglamorous groundwork underneath every DSCR calculation, worth describing plainly since most people outside credit departments have no idea it exists. An analyst takes a borrower's operating statement, re-keys income and expense line items into a spreadsheet or credit model, cross-checks the rent roll against actual collections, verifies the totals tie out, then feeds the outputs into whatever loan origination system the institution runs.
That process consumes significant senior analyst time per file before anyone even reviews it. Worth being clear about why: unstructured documents demand judgment calls at nearly every step, and judgment calls take time no matter how sharp the person making them is. Optical character recognition has real limits here too. OCR reads text off a page fine, but it can't decide which line item belongs in the NOI calculation, how to treat income from a related entity, or whether a management fee is priced at market or quietly discounted to flatter the numbers.
Multi-entity borrowers make this worse. Global cash flow analysis across a borrower's full portfolio means stitching together multiple operating statements, each with its own format, its own fiscal year, its own quirks nobody bothered to document anywhere. Every one of those documents is a fresh chance for something to get misclassified.
Errors made at the spreading stage don't stay contained; they flow straight into the DSCR calculation. A misclassified expense line, a missed vacancy adjustment, and a marginal credit clears threshold on paper when it shouldn't. Lenders relying on annual manual reviews often find out about coverage deterioration only after it's already happened, well past the point where covenant options were still on the table. Much of this traces back to the workflow rather than the analyst: the process forces skilled, well-trained people to spend most of their working hours on data entry instead of the analysis they were actually hired to do.
How AI-native platforms automate financial spreading and DSCR calculation
Automated spreading extracts data with source citations attached, so a reviewer can trace any figure back to the exact page and line it came from. It maps extracted data into the lender's own templates and DSCR model structure, and flags anomalies for a human to look at: a below-market management fee, a missing vacancy line, income that looks non-recurring.
The speed difference isn't subtle. One to three minutes per document versus 30 to 40 minutes of manual work isn't a marginal efficiency gain; it compounds across an entire pipeline of deals in a way that changes what an analyst's day actually looks like. A December 2024 analysis of multiagent AI systems in banking found analyst productivity gains across a wide range, alongside meaningfully faster credit decision turnaround. Analysts spend less time drafting spreads by hand and more time on judgment calls and exception handling, the work they were trained to do in the first place. Separately, research from V7 Labs found banks using AI underwriting reporting time-to-decision reductions for commercial loans of more than half in many cases.
A generic AI tool doesn't know a rent roll line item needs reconciliation against a lease abstract before it has any business showing up in an NOI calculation. That's a domain knowledge gap, and it's the meaningful distinction for anyone building tools specifically for commercial real estate lending rather than lending in general.
Using portfolio-level DSCR dashboards to surface risk and opportunity before they surface themselves
Knowing one loan's DSCR is underwriting, while knowing which loans across a 200-asset portfolio are drifting toward their covenant thresholds is risk management, and it needs a different kind of tool to do well.
A portfolio-level DSCR dashboard lets a lender sort the entire book by coverage band, below 1.0x, 1.0x to 1.25x, above 1.25x, and watch loans move between those bands over time instead of getting a static snapshot once a year and hoping nothing changed in between. It flags loans approaching their covenant test dates where trailing NOI is heading the wrong direction, and it also flags the opposite case: assets where coverage is actually improving, which can point to a refinancing opportunity or a legitimate case for releasing reserves back to the borrower.
Set that against the maturity figures from earlier, an estimated $936 billion coming due across the market in 2026 alone. A lender who can identify which of their own loans are approaching maturity with strong, healthy DSCR can get ahead of it, structuring an extension or refinancing proactively instead of waiting for the borrower to call first. One survey found 76% of CRE organizations already lean on automation to handle pain points like deal screening and financial spreading. Portfolio-level monitoring is the obvious next step in that direction.
Risk discovered too late carries much the same cost as risk that was never tracked in the first place. A portfolio dashboard turns coverage into a leading indicator, visible while there's still time to act on it.
What lenders should require from any system handling DSCR data and borrower financials
Borrower operating statements, rent rolls, covenant packages: this is non-public financial information, the same data driving credit decisions and covenant enforcement across a lender's book. That sensitivity should shape exactly what a lender demands from any system touching it.
Data isolation comes first. One institution's borrower financials should never train or shape outputs for a different institution using the same platform. Source citations come next: every figure a system extracts should trace back to the exact document and line it came from. Audit trails matter beyond internal tidiness too, since covenant monitoring decisions need to hold up to scrutiny from regulators and credit committees, and should make sense on their own terms to whoever ran the report.
The real risk with generic, horizontal AI tools is that platforms not built specifically for CRE lending may use submitted documents to train or improve their broader models, a genuine structural concern for any institution handling material non-public financial data. Grounding outputs in the lender's own templates matters just as much. DSCR models, spreading conventions, covenant definitions: these vary meaningfully by institution, and a platform applying its own generic logic instead of the lender's actual credit policy produces coverage numbers that don't match what the firm's underwriting standards actually call for.
Given that over 900 banks already carry CRE concentration well above their capital, regulators are looking harder not just at underwriting outcomes but at the process and controls behind them. A documented, auditable AI workflow offers a real improvement over a manual process built on spreadsheets and institutional memory that lives in one analyst's head. So ask, when evaluating any platform that's going to touch this data: does it produce source-cited outputs you can actually trace back? Does it apply your templates, not some generic version of its own? Is your data isolated from every other client on the platform, or is it quietly feeding a shared model somewhere? A vendor that can't answer that last question directly has told you what you need to know.