Interest Coverage Ratio in CRE Lending
Lenders use ICR to spot trouble before debt service ratios signal alarm.

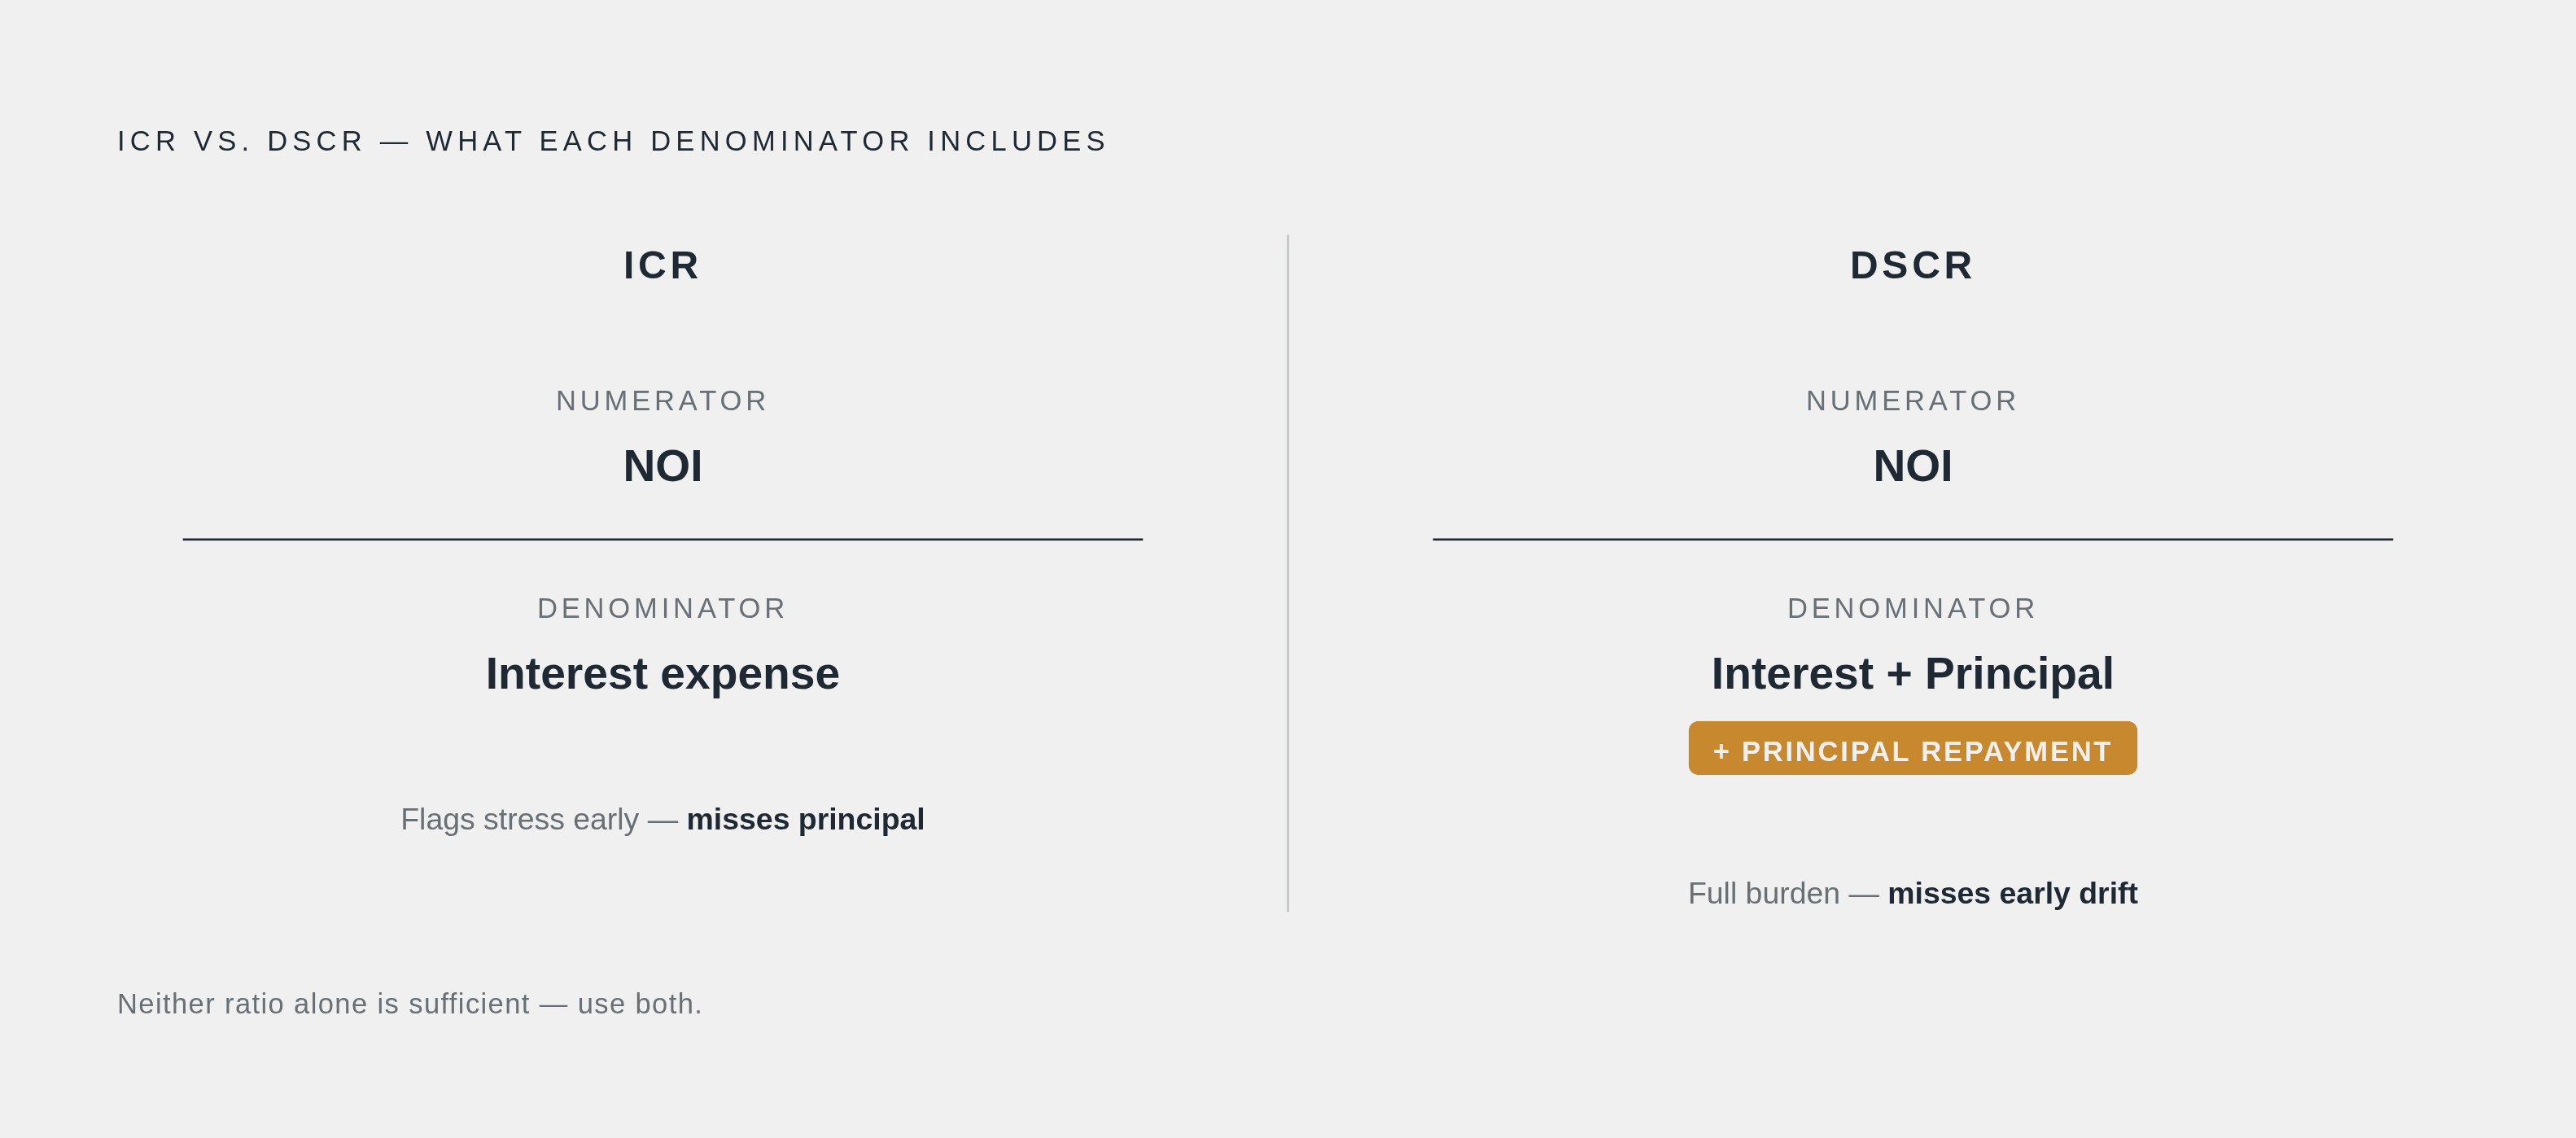
ICR is EBIT over net interest expense. Corporate finance folks call it the "times interest earned" ratio, and it's been around long enough that most of today's lending practices grew up around it rather than the other way around. CRE underwriting swaps in net operating income for EBIT, mostly because an office building doesn't file a 10-K, and nobody's arguing about its tax line. The swap works. NOI does the same job EBIT does in corporate lending, and it slides into the formula without much fuss.
DSCR is the more familiar cousin: net operating income over total debt service, meaning interest plus scheduled principal. This is the ratio that actually decides how a loan gets sized, because principal amortization is real money leaving the account every month whether anyone feels like acknowledging it or not.
ICR moves first, though. It's a narrower test; it isolates one question (can income cover interest?) instead of the whole repayment burden, and that narrowness is exactly why it can flag stress a quarter or two before a DSCR covenant trips. Think of ICR as the smoke detector and DSCR as the fire department showing up to confirm what's already burning.
Put them together and you get a fuller picture than either gives alone. A single quarter sitting at 1.30x against a 1.25x floor doesn't tell you much by itself. Three straight quarters sliding from 1.45x to 1.32x to 1.28x tells you a lot, regardless of whether the covenant number has technically snapped yet. The value is in the slope, not the altitude. Lenders who only glance at the ratio when it crosses the covenant line are checking a number once a quarter and hoping nothing moved in between.
How lenders calculate ICR for income-producing CRE assets
The formula is simple. The inputs are where people get themselves in trouble.
Building NOI correctly means starting with gross potential rent off the rent roll, subtracting vacancy and credit loss, adding back other income (parking, storage, the odd vending machine), and subtracting operating expenses: management fees, insurance, taxes, maintenance. Debt service and depreciation don't belong anywhere in this calculation; they live below the line. Interest expense should reflect what's actually being paid on the outstanding loan, not total debt service, and not some blended rate that makes the spreadsheet prettier than the building.
Now for the ways this goes wrong. A lease termination payment shows up once, inflates NOI for that period, and if a lender takes trailing twelve months at face value without asking what generated the bump, the ratio looks stronger than the asset performs. Gross rent without a vacancy haircut is its own trap, especially in markets where landlords are handing out three or four months free just to get a signature. Deferred maintenance that hasn't hit the books yet is simply an expense nobody's recognized. Floating-rate loans underwritten to today's rate instead of a stressed or capped rate end up measured against a number that probably won't survive contact with next year.
Trailing twelve months works fine for stabilized assets, since it reflects what actually happened even if it lags a recent occupancy shift. Forward or pro forma NOI gets used for transitional and lease-up properties, but it demands conservative assumptions and documentation that spells out exactly how those assumptions got built. Skip that step and the ratio starts measuring how good the spreadsheet looks instead of how the building performs.
What ICR benchmarks actually look like by property type and loan structure
Most conventional CRE lending sets a coverage floor somewhere between 1.20x and 1.35x. Fannie Mae's DUS program anchors around 1.25x minimum DSCR, adjusted for property size, location, and risk profile. CBRE reported debt service coverage at origination edged up to 1.36x in Q4 2025 from 1.35x the quarter before, a small gain arriving while underwriting standards were generally tightening around it.
Property type moves the needle more than any single benchmark suggests. Multifamily typically underwrites to lower coverage floors, since income comes from hundreds of individual leases instead of one anchor tenant, which makes the cash flow steadier, and the agency backstop doesn't hurt either. It's still catching heat where 2021 to 2022 vintage floating-rate loans are coming due. Industrial is sitting in the best position of any major asset class, with sub-1% CMBS delinquency reflecting occupancy and rent growth that hasn't slowed down. Retail runs mid-single-digit delinquency in CMBS, and lenders build wider cushions into anything that isn't necessity-based, because rollover risk on a discretionary retailer and rollover risk on a grocery-anchored center are not the same conversation.
Office is the one everybody already suspects, and for good reason. National vacancy hit 19.8% in Q4 2025 per CBRE, with major gateway cities running north of 25%, and hybrid work has cut per-employee space demand by an estimated 30 to 40% across most major markets. Lenders are either demanding much heavier coverage cushions on office or skipping it entirely. Hospitality needs the widest headroom of the bunch, because hotel income swings with the seasons and the economy in ways a multifamily rent roll simply doesn't have to.
Loan structure matters as much as property type does. Fixed-rate term loans are the easy case; the payment isn't moving, so the benchmark applies cleanly. Floating-rate and bridge loans need coverage tested against stressed or cap-rate scenarios rather than the rate sitting on the note today, and the 2021 to 2022 vintage of floating-rate multifamily and office loans remains the clearest cautionary tale on record for what happens when someone skips that stress test. Construction and transitional loans can't be tested against in-place income at all, which pushes the entire exercise onto forward NOI assumptions and milestone-based draws instead.
Worth flagging: at least one top-tier U.S. CRE lender quietly raised its minimum DSCR from 1.20x to 1.25x for stabilized assets in January 2026, and pushed transitional deals to 1.30x or higher. One data point isn't a trend. It's the kind of quiet move that tends to show up industrywide about six months after the first lender does it, though, so keep an eye out.
The environment in which ICR is being applied right now
Outstanding CRE loan balances at U.S. banks hit roughly $3.1 trillion at the end of 2025, per FDIC data, up 4.2% from the year before. That's a big, growing book, and every one of these coverage tests is running against it in real time. Origination is picking back up too: total CRE mortgage borrowing rose 16% in 2024 to $498 billion, per MBA figures, up from $429 billion in 2023. Money's moving again, into a market that's still carrying a lot of legacy risk on its books.
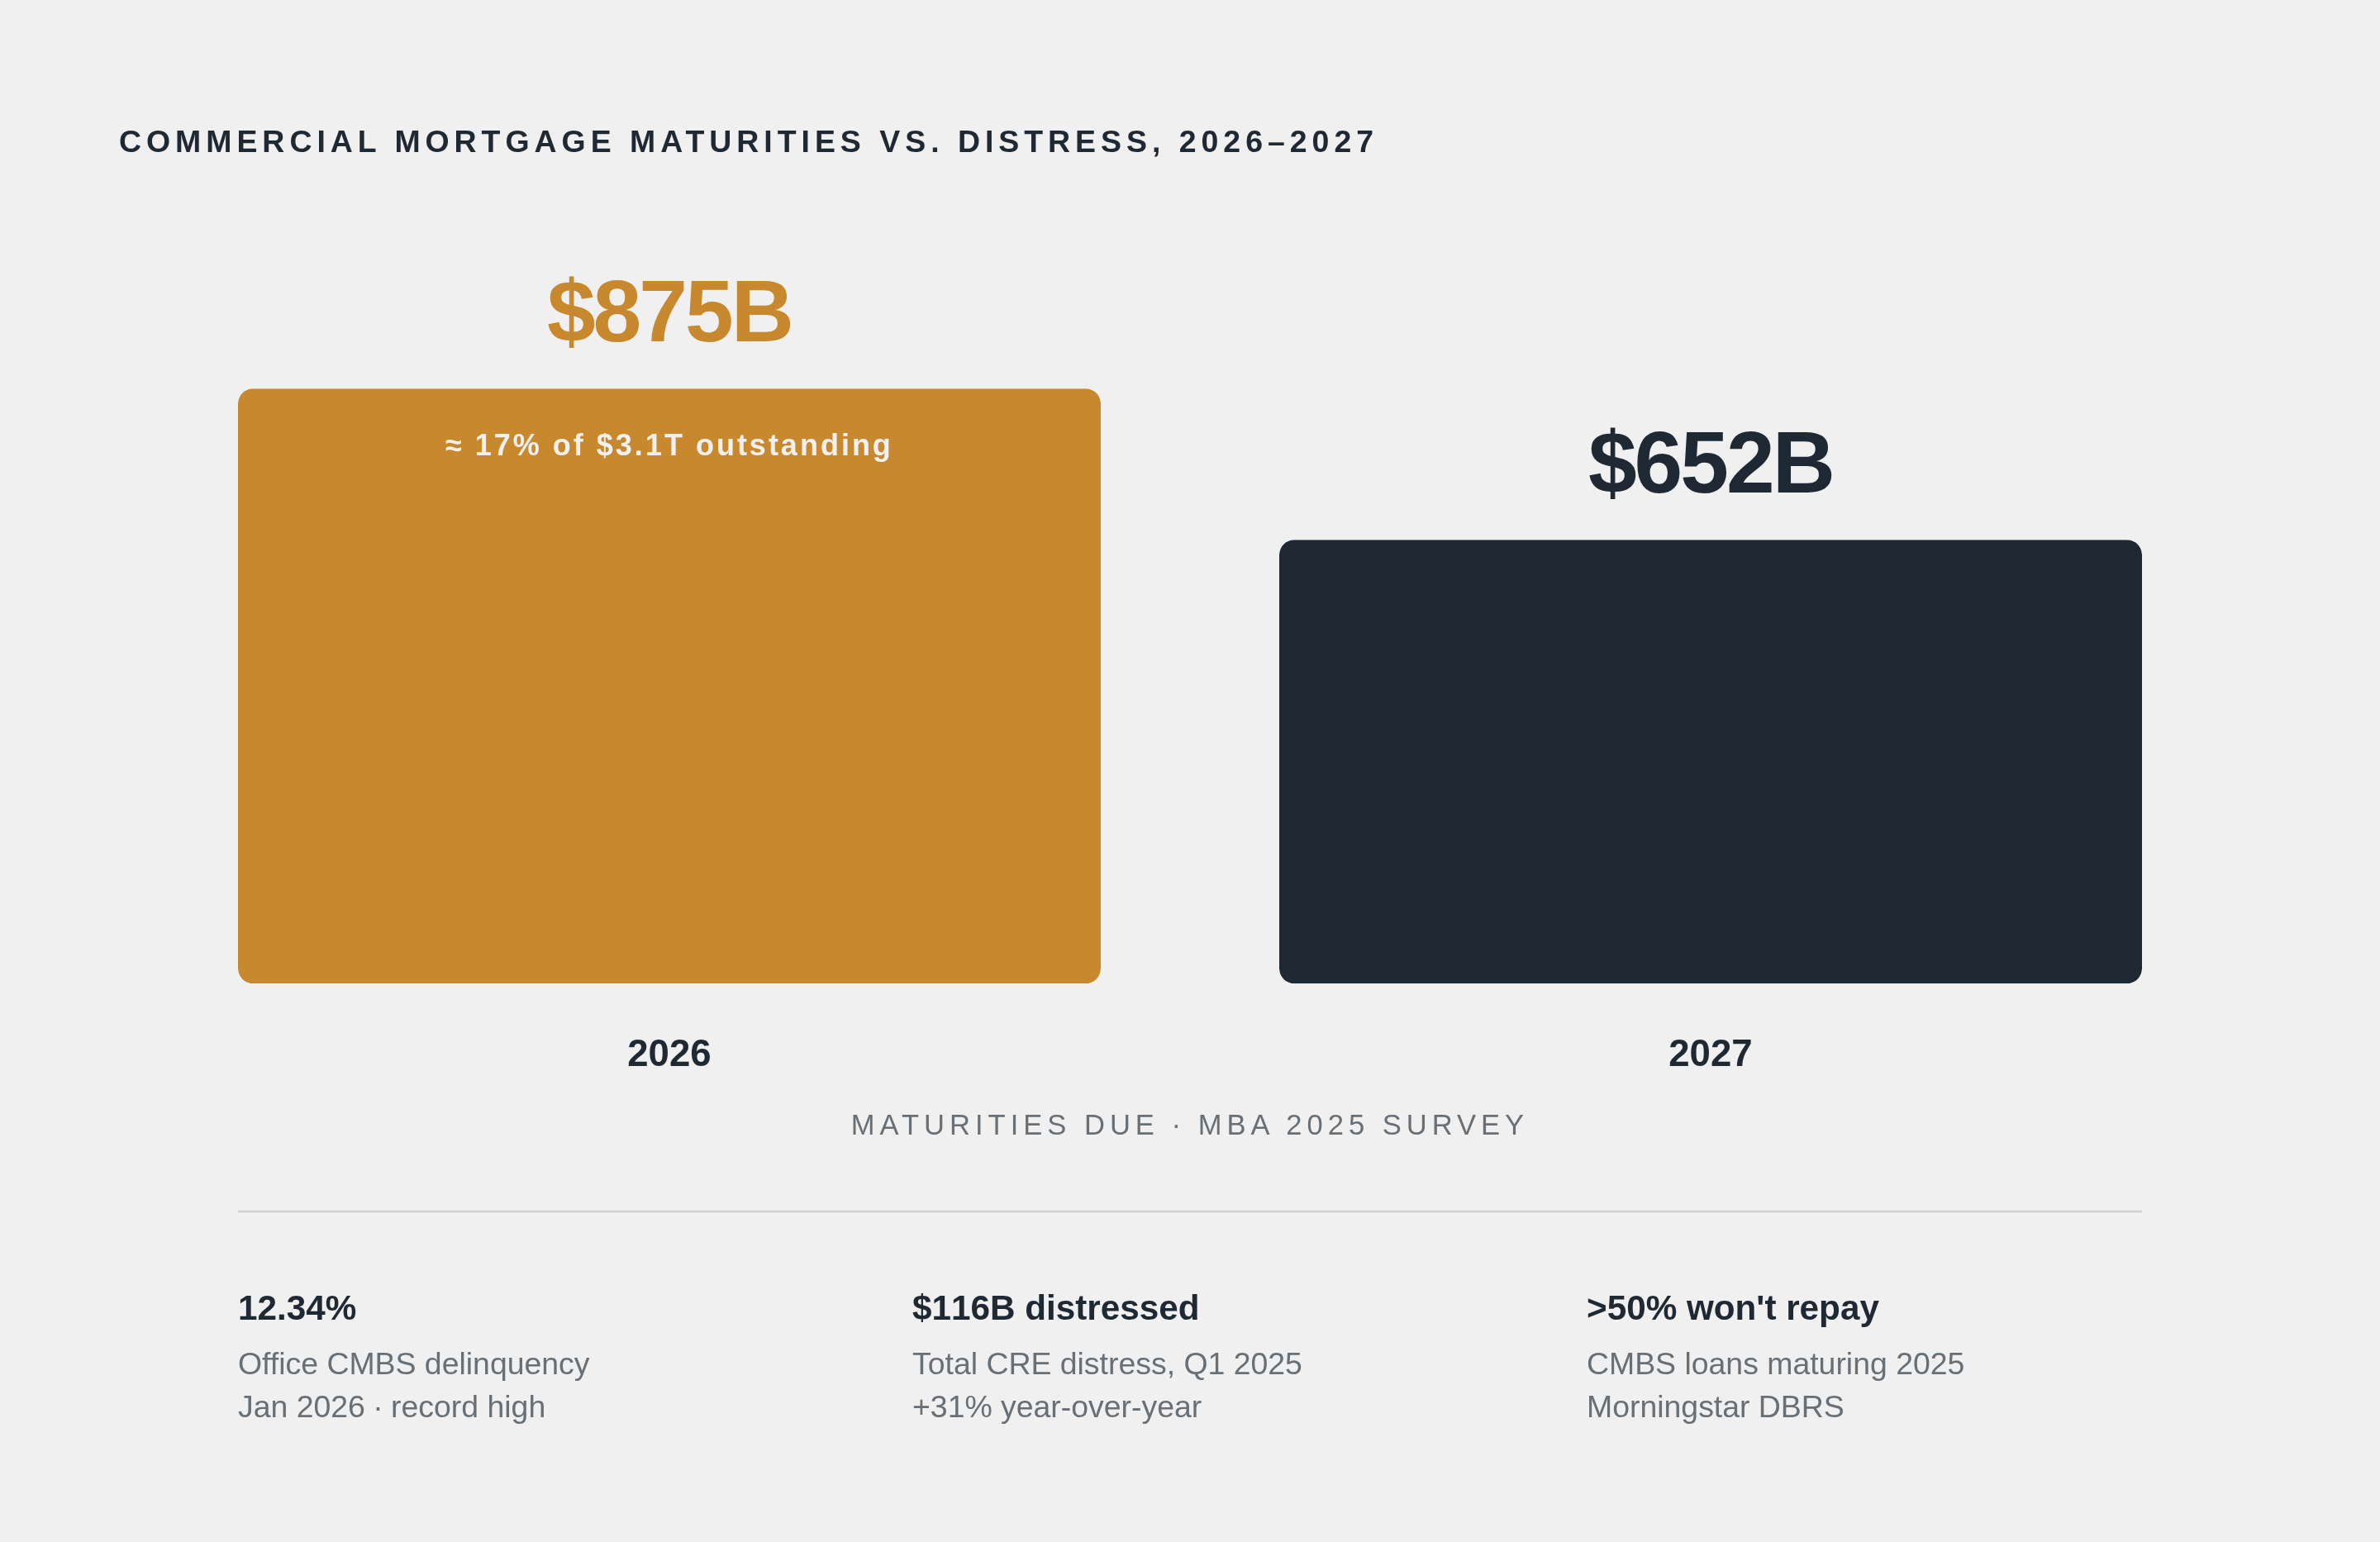
The maturity wall is the part that should have everyone's attention, honestly. MBA's 2025 loan maturity survey put $875 billion in commercial mortgage maturities on the 2026 calendar, about 17% of everything outstanding, with another $652 billion following in 2027. Loans priced sub-4% back in 2020 and 2021 are now refinancing into a rate environment that looks nothing like the one they were born into. Higher debt service on the refinance compresses ICR and DSCR even when NOI hasn't budged; where NOI has also dropped, office being the obvious example, both sides of the ratio are working against the borrower at once.
The distress numbers are already showing up, too. Office CMBS delinquency hit a record 12.34% in January 2026. More than $100 billion in fixed- and floating-rate CMBS loans mature this year, and Morningstar DBRS expects more than half won't repay at maturity, full stop. Total distressed assets reached $116 billion in Q1 2025, up 31% year over year. Exposure isn't spread evenly: smaller banks, those under $10 billion in assets, carry roughly 48.2% of their loan book in CRE, versus 13.2% at banks over $100 billion. Community and regional lenders are the ones most exposed to a deteriorating ICR trend across their portfolios, and they tend to have the leanest teams watching for it.
In an environment like this, ICR monitoring is the thing that tells a lender which loans in a stressed book are drifting toward a breach before they get there.
Why ICR as a point-in-time test misses the risk that actually matters
Most CRE covenant packages test DSCR and ICR quarterly, against trailing operating statements, with LTV reviewed annually. Risk doesn't run on that calendar, unfortunately. A coverage ratio that slips below covenant threshold in month two of a quarter won't show up in a compliance report until month three, sometimes later once the paperwork actually clears. By the time anyone sees the number, the window to do something useful about it has already shrunk.
This is the same trajectory problem from the first section, just viewed from the monitoring side instead of the underwriting side. A 1.30x reading against a 1.25x floor looks fine sitting there alone. That same 1.30x, arrived at after three straight quarters sliding down from 1.45x, is carrying a warning that a point-in-time check can't see.
One staging framework that gets used: on a 1.20x DSCR covenant, proactive borrower engagement kicks in around 1.32x, and a credit memo update triggers around 1.26x. These bands aren't universal; stabilized multifamily can run tighter, and hospitality needs more room to breathe at the same risk grade. The exact numbers matter less than having bands at all, instead of waiting for the covenant to snap before anyone does anything.
There's a scalability wall here too. A workflow that runs fine for ten loans starts creaking at fifty and falls over at two hundred, and the standard fix, hiring more people to read more spreadsheets, is expensive, slow, and doesn't scale any better than the problem it's supposedly solving. Manual review cycles also flatten everything: a stable, well-performing asset gets the same quarterly glance as one that's two quarters from breaching covenant. That's closer to risk management theater than the real thing.
Then there's the data underneath all of it. A coverage ratio is only as good as the income figures feeding it, and if the rent roll is stale, missing a tenant departure, or silent on an unreported rent abatement, the ratio can look perfectly healthy while describing a building that doesn't exist in that form anymore. A 2025 Federal Reserve working paper found that banks leaning heavily on borrower-reported performance data are slower to update risk ratings as that data ages, and that borrowers with stale financials show meaningfully higher subsequent default rates. Feed it bad data, get back a confident, wrong answer.
How automated covenant monitoring changes the ICR surveillance problem
Start with continuous data ingestion, because that's where most of the timing gap gets closed. Automated systems pull operating statements, rent rolls, and borrower financials in as they arrive, rather than relying on someone keying numbers off a PDF once a quarter, and the ratio recalculates whenever new data lands rather than on a fixed date on the calendar.
Trend-line visibility is the other half of it. A system showing the current ICR reading next to the last six quarters turns surveillance into something that anticipates a breach instead of discovering one after the fact. It also enables risk-tiered attention: loans trending down get watched closely, stable loans get a lighter touch, and nobody's burning analyst hours re-verifying a healthy multifamily asset for the twelfth quarter in a row.
Financial spreading is where a lot of the manual grind actually lives, and it's also where automation shows up fastest. Pulling NOI inputs out of raw operating statements into a standardized template used to eat hours, sometimes days, per loan; research on AI-assisted spreading suggests that work can now happen in under 10 minutes per document set. That's the gap between reviewing a portfolio quarterly and reviewing it continuously, and it's not a small gap.
Some platforms in this space automate financial spreading from CRE documents into standardized templates built on configured underwriting logic, and handle covenant monitoring with trend-line visibility across quarters. Every extracted figure carries a source citation, so a lender can trace a number back to the document it came from, which speaks directly to the stale-data problem the Fed paper flagged above. Portfolio dashboards surface which loans are trending toward a coverage floor before they've actually crossed it.
There's also a data-integrity layer worth mentioning: cross-document checks that reconcile rent roll totals against collection schedules catch inconsistencies that would otherwise produce a misleading ICR reading, and that matters more by the month as manipulated or just plain sloppy documents get harder to catch by eye alone.
The system surfaces the signal and the trend. Deciding what to do with it, waiver, workout, acceleration, still sits with the lender, and automation's role here stays narrow: making sure nobody's deciding off a number that was already stale by the time they looked at it.
Where ICR has hard limits and what lenders should not ask it to do
ICR was never built to answer every question, and that's exactly where lenders get themselves into trouble, asking it to. It says nothing about principal amortization, which is the entire reason DSCR exists as a separate, mandatory test rather than a nice-to-have add-on. Liquidity is another blind spot. A borrower can show a perfectly healthy ICR on paper and still not have cash sitting in the account to cover a tax bill due next Tuesday, because coverage is a solvency question, not a can-you-pay-today question.
Bad inputs don't get fixed by the ratio. Run the cleanest ICR calculation in the world against a stale rent roll and you get a precise, confident, wrong answer; the ratio has no idea the anchor tenant gave notice last month if nobody bothered to tell it. It can't substitute for a stress test on floating-rate exposure either. A coverage ratio calculated at today's rate on a loan repricing next year is measuring a temporary condition and reporting it as permanent, and the 2021 to 2022 floating-rate vintage already showed everyone exactly how that story ends.
ICR does have real strengths: it's fast, it's cheap, and its trend line is one of the earliest signals a lender gets that something's shifting under a loan. Give it that one job, pair it with DSCR for the fuller picture, and keep the data feeding it current. Ask it to carry the whole underwriting decision on its own, though, and it'll come up short right when the stakes are highest.