Commercial Real Estate Loan Sizing Calculators
Four tests determine the maximum commercial real estate loan, and the lowest result wins.

Every commercial loan sizing analysis runs through four tests, and the loan cannot exceed any of them. The shortest constraint wins.
Debt Service Coverage Ratio (DSCR) measures whether a property's net operating income covers its required debt payments, principal and interest combined. The ratio is NOI divided by annual debt service; lenders require it to clear some minimum threshold. What makes DSCR operationally interesting is its sensitivity to loan terms: the same loan amount produces meaningfully different debt service depending on rate and amortization schedule. Agency multifamily programs through Fannie Mae, Freddie Mac, and FHA/HUD each publish distinct DSCR floors; CMBS conduits impose their own. When DSCR is the binding constraint, the property's income is the limiting factor, not its value.
Loan-to-Value (LTV) caps the loan as a percentage of appraised value. This is the lender's loss-given-default protection: if the borrower defaults, the collateral needs to be worth more than the outstanding balance. Maximum LTV thresholds vary by property type, loan program, and market conditions. When LTV is the binding constraint, the appraised value is lower than what a DSCR-constrained calculation would otherwise permit, or the lender's program simply sets a conservative ceiling regardless of income.
Debt Yield is NOI divided by loan amount. What distinguishes it from DSCR is what it deliberately omits: no interest rate, no amortization period, no loan term. It expresses the lender's return on the outstanding balance as if foreclosure occurred today and the lender operated the asset on its current income. That structural feature is precisely why debt yield has become prominent as a standalone covenant in CMBS and institutional lending. It cannot be engineered by extending amortization. When debt yield is the binding constraint, income is thin relative to loan balance, which is the signature condition of low-cap-rate markets where asset values have run well ahead of cash flows.
Loan-to-Cost (LTC) applies primarily to construction and value-add lending, capping the loan as a percentage of total project cost. Closing costs sit in the denominator. Borrowers who compute LTC against hard costs alone routinely discover their actual leverage is lower than modeled.
How the four constraints interact to set the actual loan ceiling
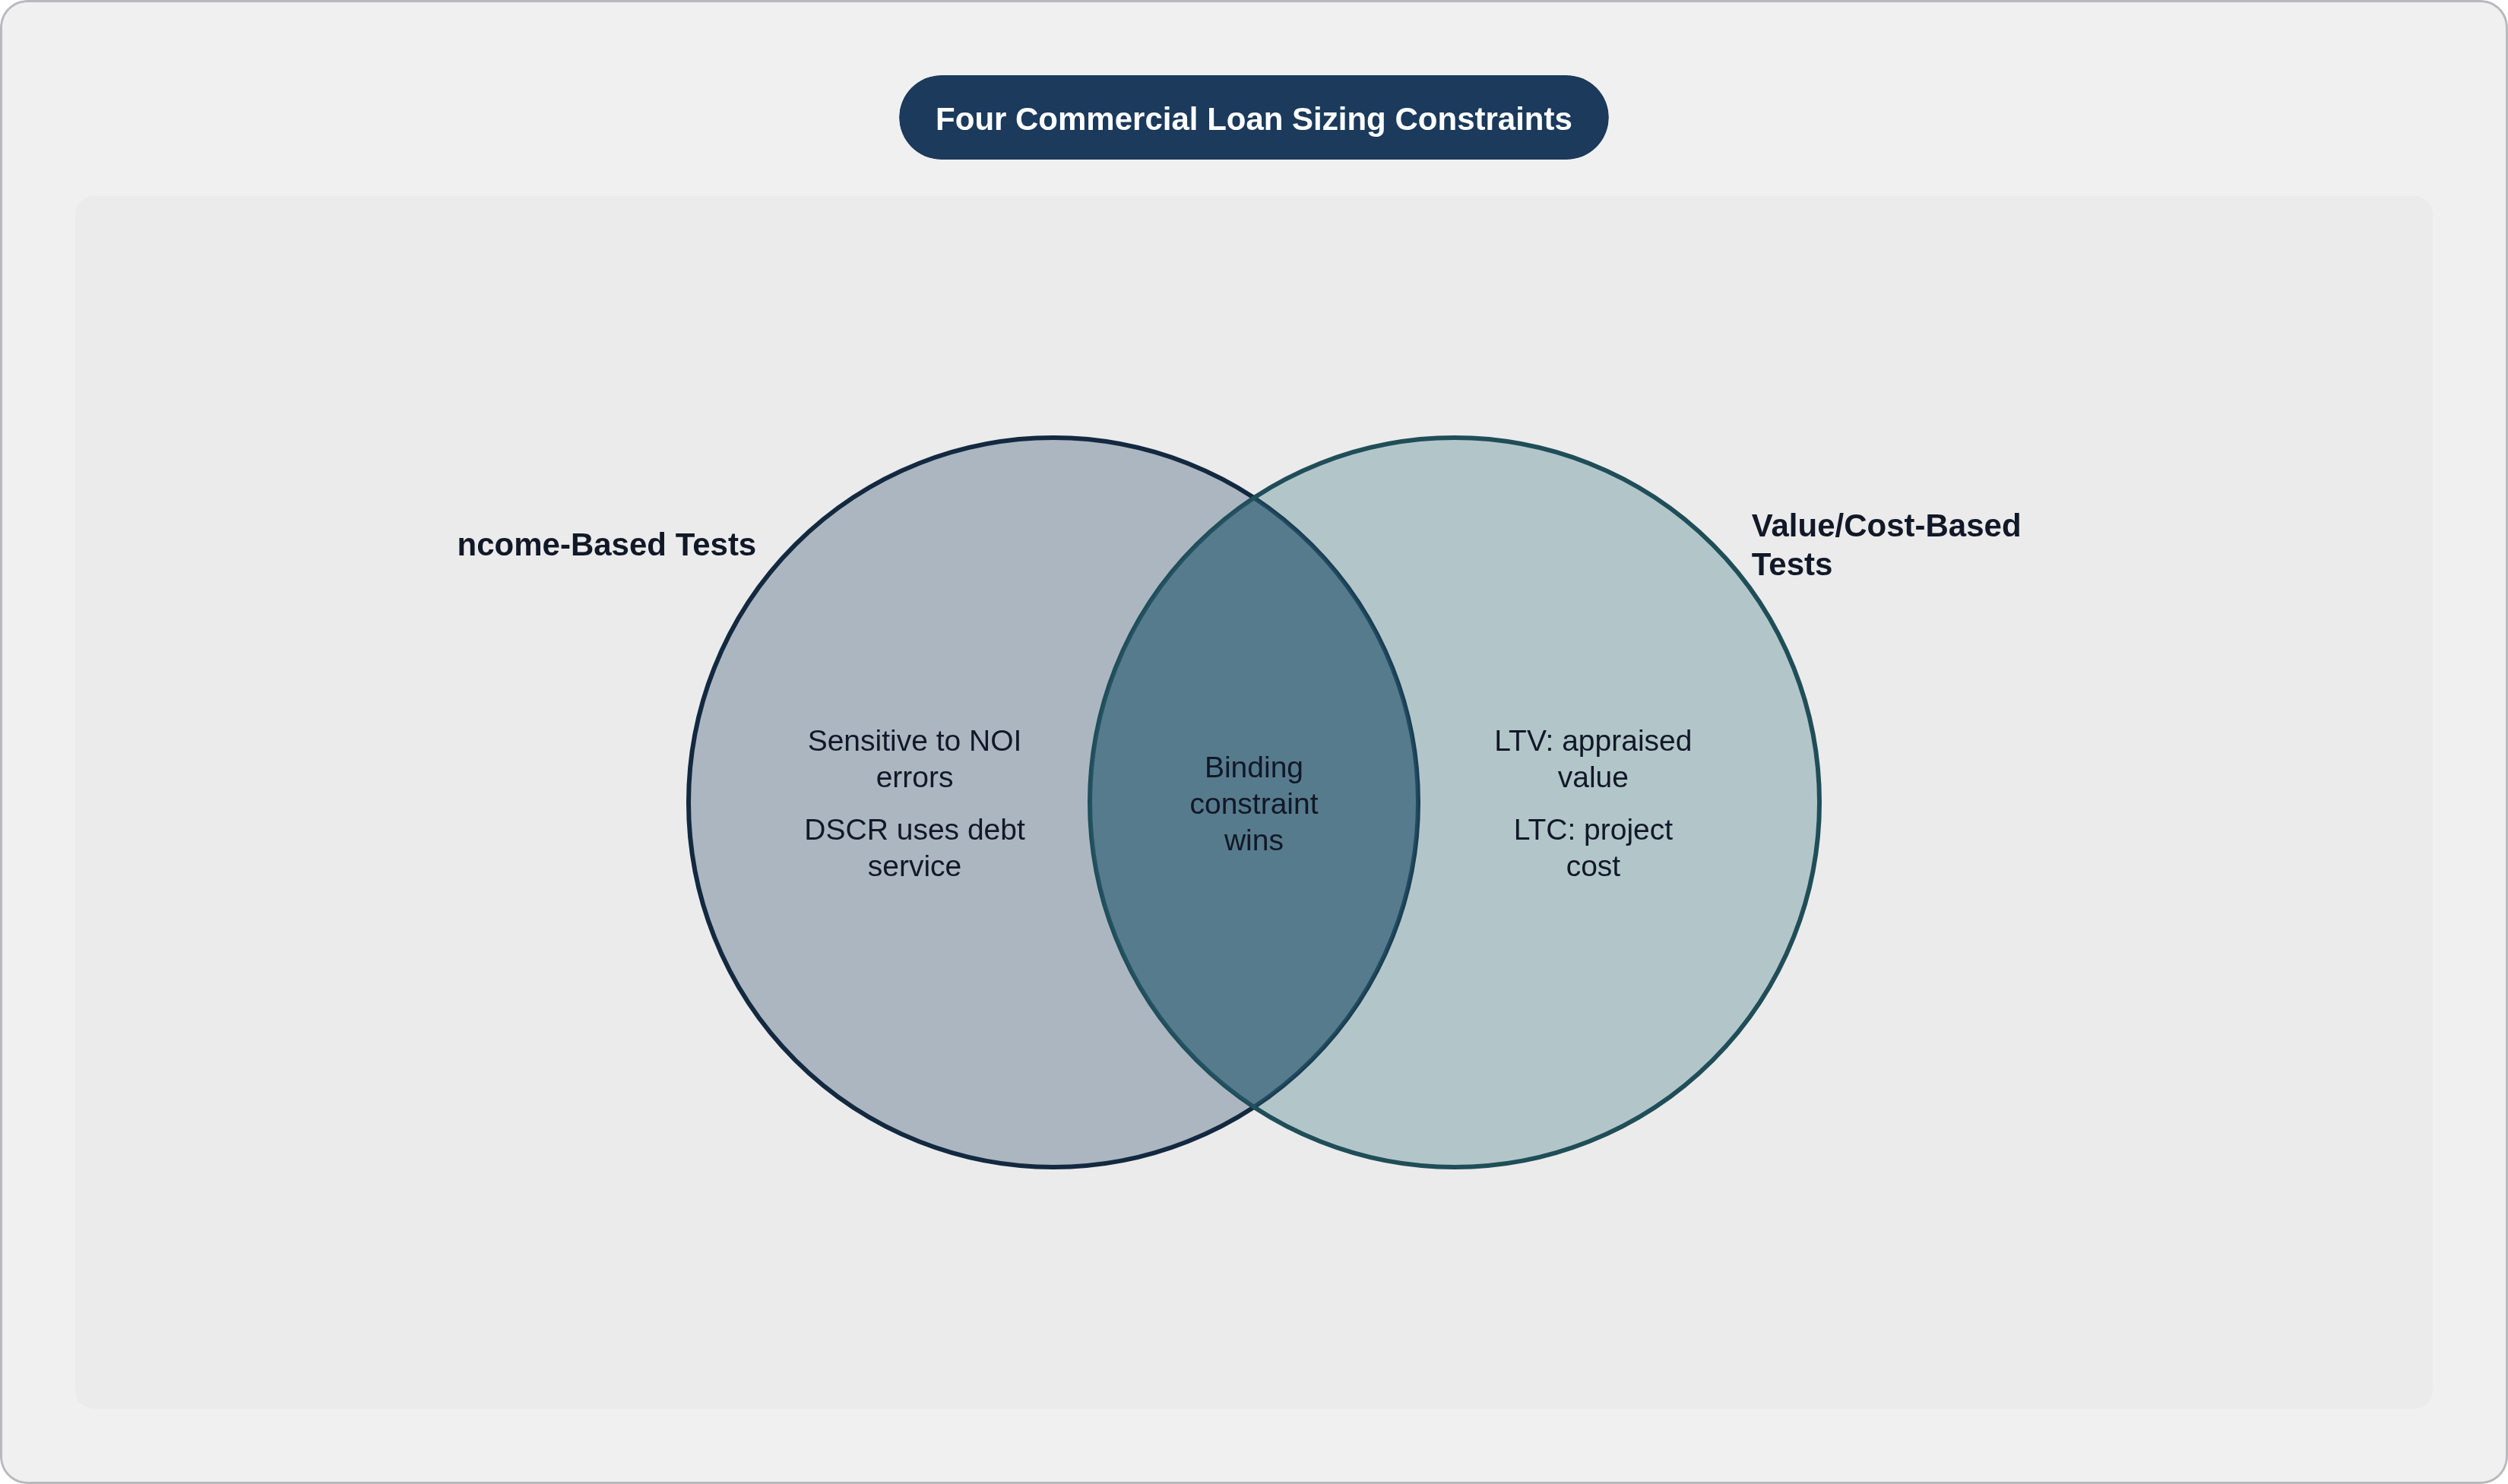
A real sizing run applies all applicable constraints simultaneously. The loan is set at the lowest result. Not the average. Not the most favorable.
That sounds straightforward until the constraints start pulling in different directions. Consider what happens when interest rates rise sharply: annual debt service increases, DSCR falls, and the income-constrained loan amount compresses. Debt yield, which contains no rate variable, is unmoved. A loan that passes the debt yield test simultaneously fails DSCR, and neither the property nor the borrower changed. The rate environment moved and the constraints diverged.
The opposite divergence is common in trophy asset markets. A property with a compressed cap rate, one where investors have bid the price up relative to its income, supports a large loan on an LTV basis because appraised value is high. But the same thin income, divided by debt service on that large loan, produces a DSCR that fails the lender's floor. High-value, low-income assets routinely surface this mismatch well into underwriting.
Why exactly does this matter for analysts? Because diagnosing which constraint is binding determines what can actually be fixed. If DSCR is the binding test, changing the LTV assumption accomplishes nothing. If LTV is binding, improving the NOI projection does not move the ceiling. A borrower who inflates revenue projections to engineer a larger loan will likely find that the binding test is debt yield or LTV, neither of which responds to NOI optimism.
It is also worth considering what loan term and amortization actually do here. Extending amortization reduces annual debt service and can improve DSCR, but it has no effect on debt yield. Borrowers sometimes negotiate extended amortization as a sizing solution without first confirming that DSCR was the binding constraint in the first place.
The inputs that move the number and how lenders set their floors
Of all the inputs in a sizing model, NOI is the most consequential. It drives DSCR and debt yield simultaneously, so an error in NOI, deliberate or accidental, distorts every income-based test at once.
NOI is not a number that arrives clean. It is assembled from gross potential income, vacancy and collection loss assumptions, operating expenses, and reserves. Lenders routinely normalize the borrower's presented figure: underwritten NOI differs from trailing twelve-month actuals because the lender adjusts vacancy to market stabilization, adds management fee reserves, or excludes one-time items. What the borrower presents and what the lender underwrites are often meaningfully different, and the sizing run works off the lender's version.
Interest rate and amortization period determine annual debt service, the denominator in the DSCR calculation. A rate increase that looks modest in basis points produces a meaningful annual debt service increase on a multi-million-dollar loan, which compresses DSCR and reduces the maximum loan the coverage test permits.
Appraised value and total project cost are external inputs the lender verifies independently. They are not taken from the borrower's model. The lender controls the numbers that drive LTV and LTC, which is itself a form of underwriting discipline.
Lender policy floors are where institutional variation actually lives. Minimum DSCR, maximum LTV, minimum debt yield: these are not universal standards. Agency programs publish their matrices; CMBS conduits have their own requirements; balance-sheet lenders typically keep their matrices proprietary. Floors tighten in stress periods and loosen when capital is abundant. The same property, with identical financials, will support different loan amounts from different lenders under different market conditions. When one lender's maximum is significantly higher than another's, the difference tends to trace to a specific policy floor or a divergence in how NOI was normalized.
Where manual calculator workflows introduce compounding error
A typical commercial loan file arrives as a collection of PDFs: scanned operating statements, rent rolls, tax returns, borrower-prepared schedules. An analyst keys these into a spreadsheet. The same figures get re-entered into a loan origination system and again into a credit memo. Each transfer is a new opportunity for inconsistency.
Manual spreading of a trailing twelve-month operating statement is where NOI errors typically originate. Expenses get misclassified. Vacancy adjustments get missed or applied inconsistently across comparable deals. Line items get mapped differently depending on which analyst is building the model. NOI errors propagate simultaneously through DSCR and debt yield, so a small misstatement in the most critical input distorts the entire sizing output.
There is a subtler problem worth sitting with. Because constraints run in parallel, an error that understates NOI can make a different constraint appear binding than the one actually limiting the loan. The analyst diagnoses the wrong constraint, pursues the wrong remedy, and the entire subsequent negotiation proceeds from a flawed premise. The borrower is pushing on assumptions that do not affect the real ceiling, and nobody in the room realizes it.
Version control is the unglamorous endpoint of all this. Which NOI figure is the underwritten number? The spreadsheet, the credit memo, and the loan origination system carry different figures without any single party flagging the divergence. The calculator's logic is sound. Its defensibility depends entirely on the inputs it receives, and manual workflows are a structurally fragile foundation for a decision involving tens of millions of dollars.
How automated spreading and AI-assisted underwriting change what the calculator receives
Automated financial spreading extracts figures from operating statements, rent rolls, and borrower financials using machine learning, eliminating the manual re-keying step between document and model. What changes is not the sizing logic; the DSCR formula remains what it is. What changes is the consistency and reliability of what enters that formula.
Normalization and categorization of line items happen the same way on every file, not according to each analyst's individual conventions on a given Tuesday. Anomaly detection becomes a meaningful secondary benefit: automated systems flag unusual expense ratios or vacancy figures that a rushed analyst might normalize past, accepting a number that deserves scrutiny. Cycle time compression for standard deals has been documented across multiple implementations, compressing what historically required hours of analyst time into minutes.
The analyst's role shifts. Instead of building the spreadsheet, the analyst reviews the normalized NOI, challenges the model's categorizations, and makes the credit judgment.
A general-purpose language model can misread a rent roll's column structure, misclassify a management fee, or conflate gross potential rent with effective gross income. Those errors feed directly into the NOI that drives sizing. CRE-specialized platforms are engineered around the specific document structures that commercial real estate underwriters actually work with. Rent rolls, trailing twelve-month statements, and offering memoranda have their own conventions; DSCR, debt yield, NOI, and LTV are native concepts in purpose-built CRE systems, not adaptations grafted onto general-purpose architecture. That distinction matters most precisely because the document types most likely to produce extraction errors are the ones that matter most.
Once data extraction is automated, stress-testing becomes practical at portfolio scale. Running interest-rate shock scenarios across a large loan book becomes a software task rather than an analyst marathon. The constraint was largely data preparation.
Loan sizing within a live portfolio: from point-in-time calculation to ongoing covenant intelligence
The metrics that size the loan become the covenants that govern it. The minimum DSCR, maximum LTV, and minimum debt yield that determined the loan amount at closing are typically written into the loan agreement as ongoing compliance tests. The calculator does not retire at funding; it becomes the measurement instrument for the life of the loan.
A lender with a substantial book of active commercial loans must track many covenant thresholds across many properties every quarter. Scale alone makes manual spreadsheet review structurally insufficient at institutional size. But scale is only part of the problem.
Risk does not operate on a quarterly review schedule. Property performance deteriorates between covenant test dates, and a breach surfacing at the next quarterly review has been developing for months. The lender discovers the problem when the borrower's options are narrowest and the lender's ability to influence outcomes is most reduced.
AI covenant monitoring applies the same sizing logic continuously. It reads the loan agreement, maps covenants to live property financials, and flags deterioration trends before a technical breach occurs. The arithmetic is identical to the origination calculator; the difference is frequency.
A large volume of commercial loans are approaching maturity in the near term, creating concentrated refinancing and credit decision pressure.
What a well-constructed loan sizing analysis actually looks like in practice
A defensible sizing analysis begins with a normalized, independently verified NOI, not the borrower's presented figure accepted without adjustment. The normalization process, the specific adjustments made and the reasoning behind them, should be documented so that the credit committee evaluates the assumptions rather than simply accepts the output.
All four applicable constraints run simultaneously. The analyst records which one is binding and why, not just the resulting loan amount. If the analyst cannot explain which test is limiting the loan and what would need to change to move it, the analysis is not finished.
Sensitivity tables are not optional; they are the core of the analysis. The loan size should be understood as a range across stressed assumptions: higher vacancy, higher rates, lower appraised value. A single-point output is false precision. Loan terms, specifically rate and amortization, should be documented with their explicit effect on debt service and DSCR, so the credit committee sees the arithmetic and not just the ratio.
The sizing output should connect forward to the covenant structure. The DSCR floor and debt yield minimum that will govern the loan through its term should be consistent with the underwriting assumptions used to size it. When they diverge, the lender has underwritten to one set of assumptions and covenanted to another, a contradiction that tends to surface at the worst possible moment.
At the institutional level, none of this is a one-deal exercise. The same logic must be applied consistently across a pipeline and then monitored across an active book. The calculator encodes sound logic. Its defensibility depends entirely on the judgment that validates its inputs and interrogates what the outputs actually mean.