Standardizing NOI Calculations Across Asset Types
Different asset classes require different NOI calculation methods to produce comparable results.

There is a quiet, persistent problem in commercial real estate underwriting, and it sits inside a formula almost everyone agrees on. Ask any two practitioners to define NOI, and they will give you the same answer: gross income minus operating expenses, before debt service, capital expenditures, and taxes. Ask them to calculate it for the same property and hand you the results, and you will sometimes find a gap you cannot explain without a twenty-minute conversation about conventions.
That gap is what this article is about.
NOI is not disputed as a concept. What is disputed, constantly and consequentially, is what gets counted as income, what qualifies as an operating expense, and which conventions govern those decisions for a given asset type. The formula is universal. The inputs are not. Understanding the difference between those two facts is what separates cross-portfolio analysis that illuminates from cross-portfolio analysis that misleads. Think of the formula as a map and the inputs as the terrain: the map is the same for everyone, but if you're reading the wrong terrain, you'll end up somewhere you didn't intend to go.
Why the Same Property Can Produce Two Different NOI Figures Depending on Who Ran the Numbers
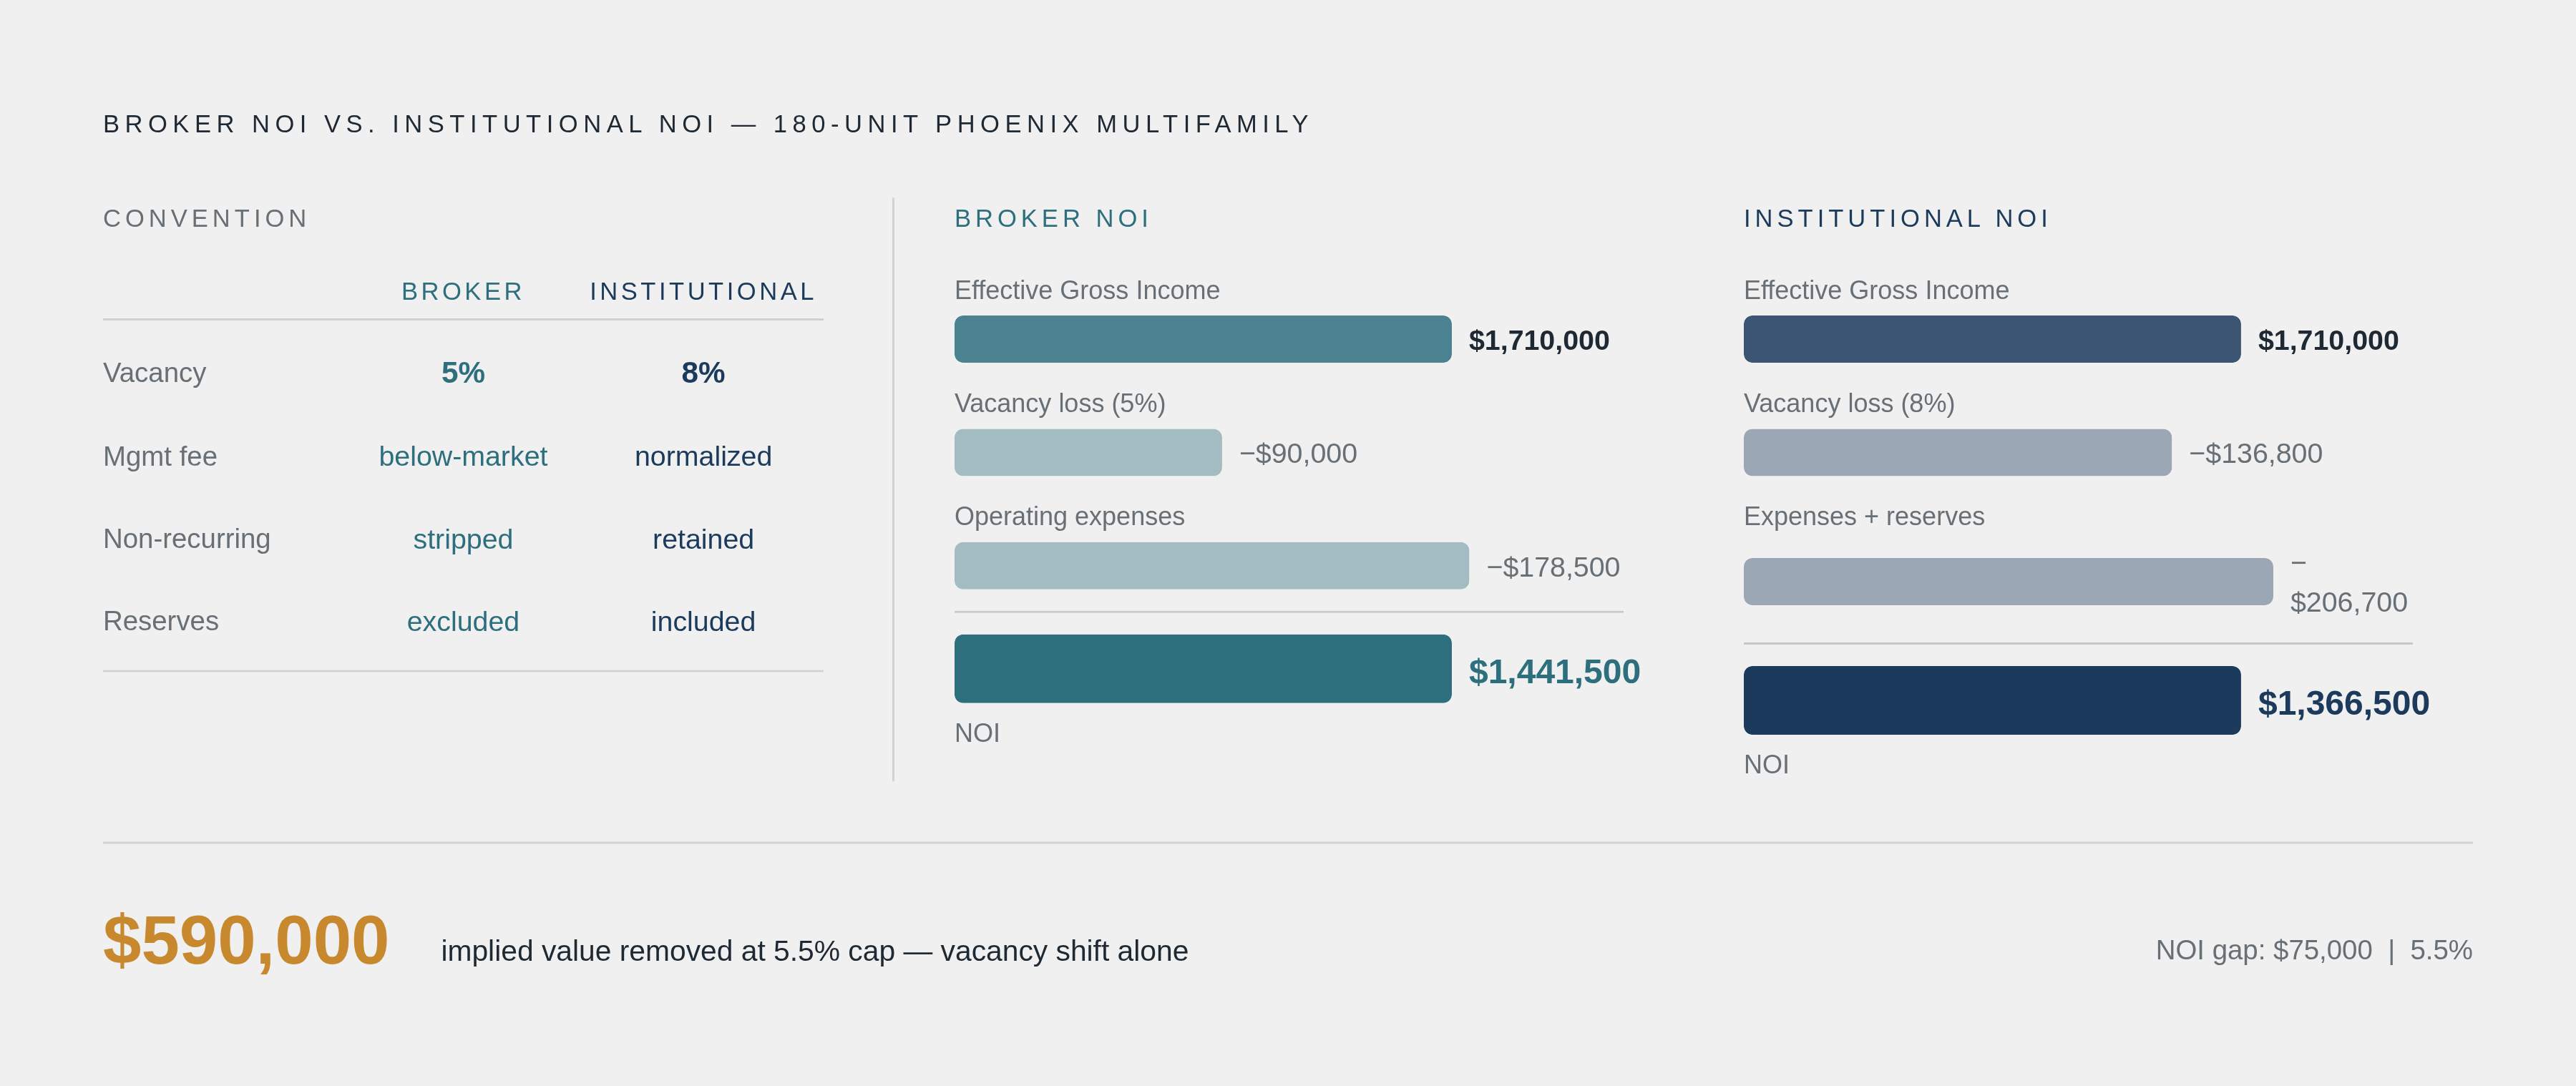
The canonical version of this problem is the broker-versus-institutional-investor NOI gap. It is not a conspiracy. It is a conventions mismatch, and it is remarkably consistent.
Broker NOI typically uses market vacancy, which runs lower than in-place vacancy during periods of softness. It applies the management fee at whatever rate the current operator charges, which is often below market. It strips non-recurring expenses aggressively and, critically, excludes replacement reserves from the operating expense line. Institutional NOI, by contrast, uses the higher of in-place or submarket vacancy, normalizes the management fee to a market rate even if the current operator charges less, retains non-recurring expenses unless they are explicitly normalized with written disclosure, and treats reserves consistently. On the same property, these conventions typically produce a divergence of five to ten percent.
To make that concrete: consider a 180-unit multifamily asset in Phoenix. Institutional underwriting produces an NOI of $1,366,500. The broker's model on the same property comes to $1,441,500, a gap of roughly 5.5 percent. That sounds manageable until you apply a cap rate. At a 5.5 percent cap rate, shifting the vacancy assumption from five to eight percent removes nearly $590,000 of implied value. A casual review of the proforma will not flag a three-point vacancy change as material. It is.
Then there is the reserves convention dispute, which compounds the problem. NCREIF and MBA convention places replacement reserves below the NOI line, at approximately $300 to $400 per unit per year for multifamily and $0.20 to $0.40 per square foot per year for office and retail. Many lenders include reserves above the line for debt-service coverage ratio calculations and loan sizing. Neither approach is wrong in its context. But mixing them makes cap rates non-comparable to comp data even when the underlying property is identical.
That raises an important question: if two professionals use the same formula and produce different NOIs, which one is correct? The honest answer is that both can be internally consistent and externally meaningless for comparison purposes. The formula is not in dispute. The inputs are. Understanding which conventions apply to which asset type is the only thing that makes cross-portfolio comparison reliable. Two analysts, one formula, two answers — the NOI is in the eye of the beholder.
The Reporting Standards That Define What "Correct" NOI Looks Like by Property Type
The industry has not been passive about this problem. Several frameworks exist specifically to impose definitional discipline on NOI reporting, and their structure is instructive.
NCREIF and the Pension Real Estate Association co-sponsor reporting standards designed to establish information transparency and consistency across institutional portfolios. In a March 2024 open session, the initiative added recommended asset-level data points: trailing twelve-month NOI, expense ratio, and ten-year rent growth as standardized reporting fields. The NCREIF Property Index relies on these conventions directly. As of Q4 2024, the NPI covered 12,767 properties totaling just under $900 billion in market value, with cap rates derived from trailing NOI calculated under NCREIF's standardized format. NPI NOI growth turned slightly negative in Q4 2024 after remaining positive throughout the rest of the year. That figure is analytically meaningful precisely because the NOI being measured is calculated consistently across every contributor. Remove that consistency and the index loses its interpretive value entirely.
The CRE Finance Council's Investor Reporting Package, currently at version 8.4, goes further in acknowledging the asset-class specificity problem. The CREFC IRP maintains separate NOI Adjustment Worksheets for commercial properties, multifamily, lodging, and healthcare. This is the clearest institutional acknowledgment in standard loan reporting that NOI must be calculated differently by property type, not as a matter of preference but as a matter of accuracy.
Other authoritative benchmarks operate in parallel lanes. IREM publishes Income/Expense Analysis reports for conventional multifamily, office, shopping centers, and condominiums. BOMA International produces its Experience Exchange Report for office properties. CBRE Research publishes quarterly cap-rate and operating-expense surveys by sector. What these frameworks share is that each calibrates its benchmarks to its asset type's lease structure, expense responsibility conventions, and income composition. They are not using different formulas. They are recognizing that the same formula must be fed with asset-specific inputs to produce meaningful output.
How Lease Structure Is the Variable That Makes NOI Non-Comparable Across Asset Classes Before Any Other Difference Is Considered
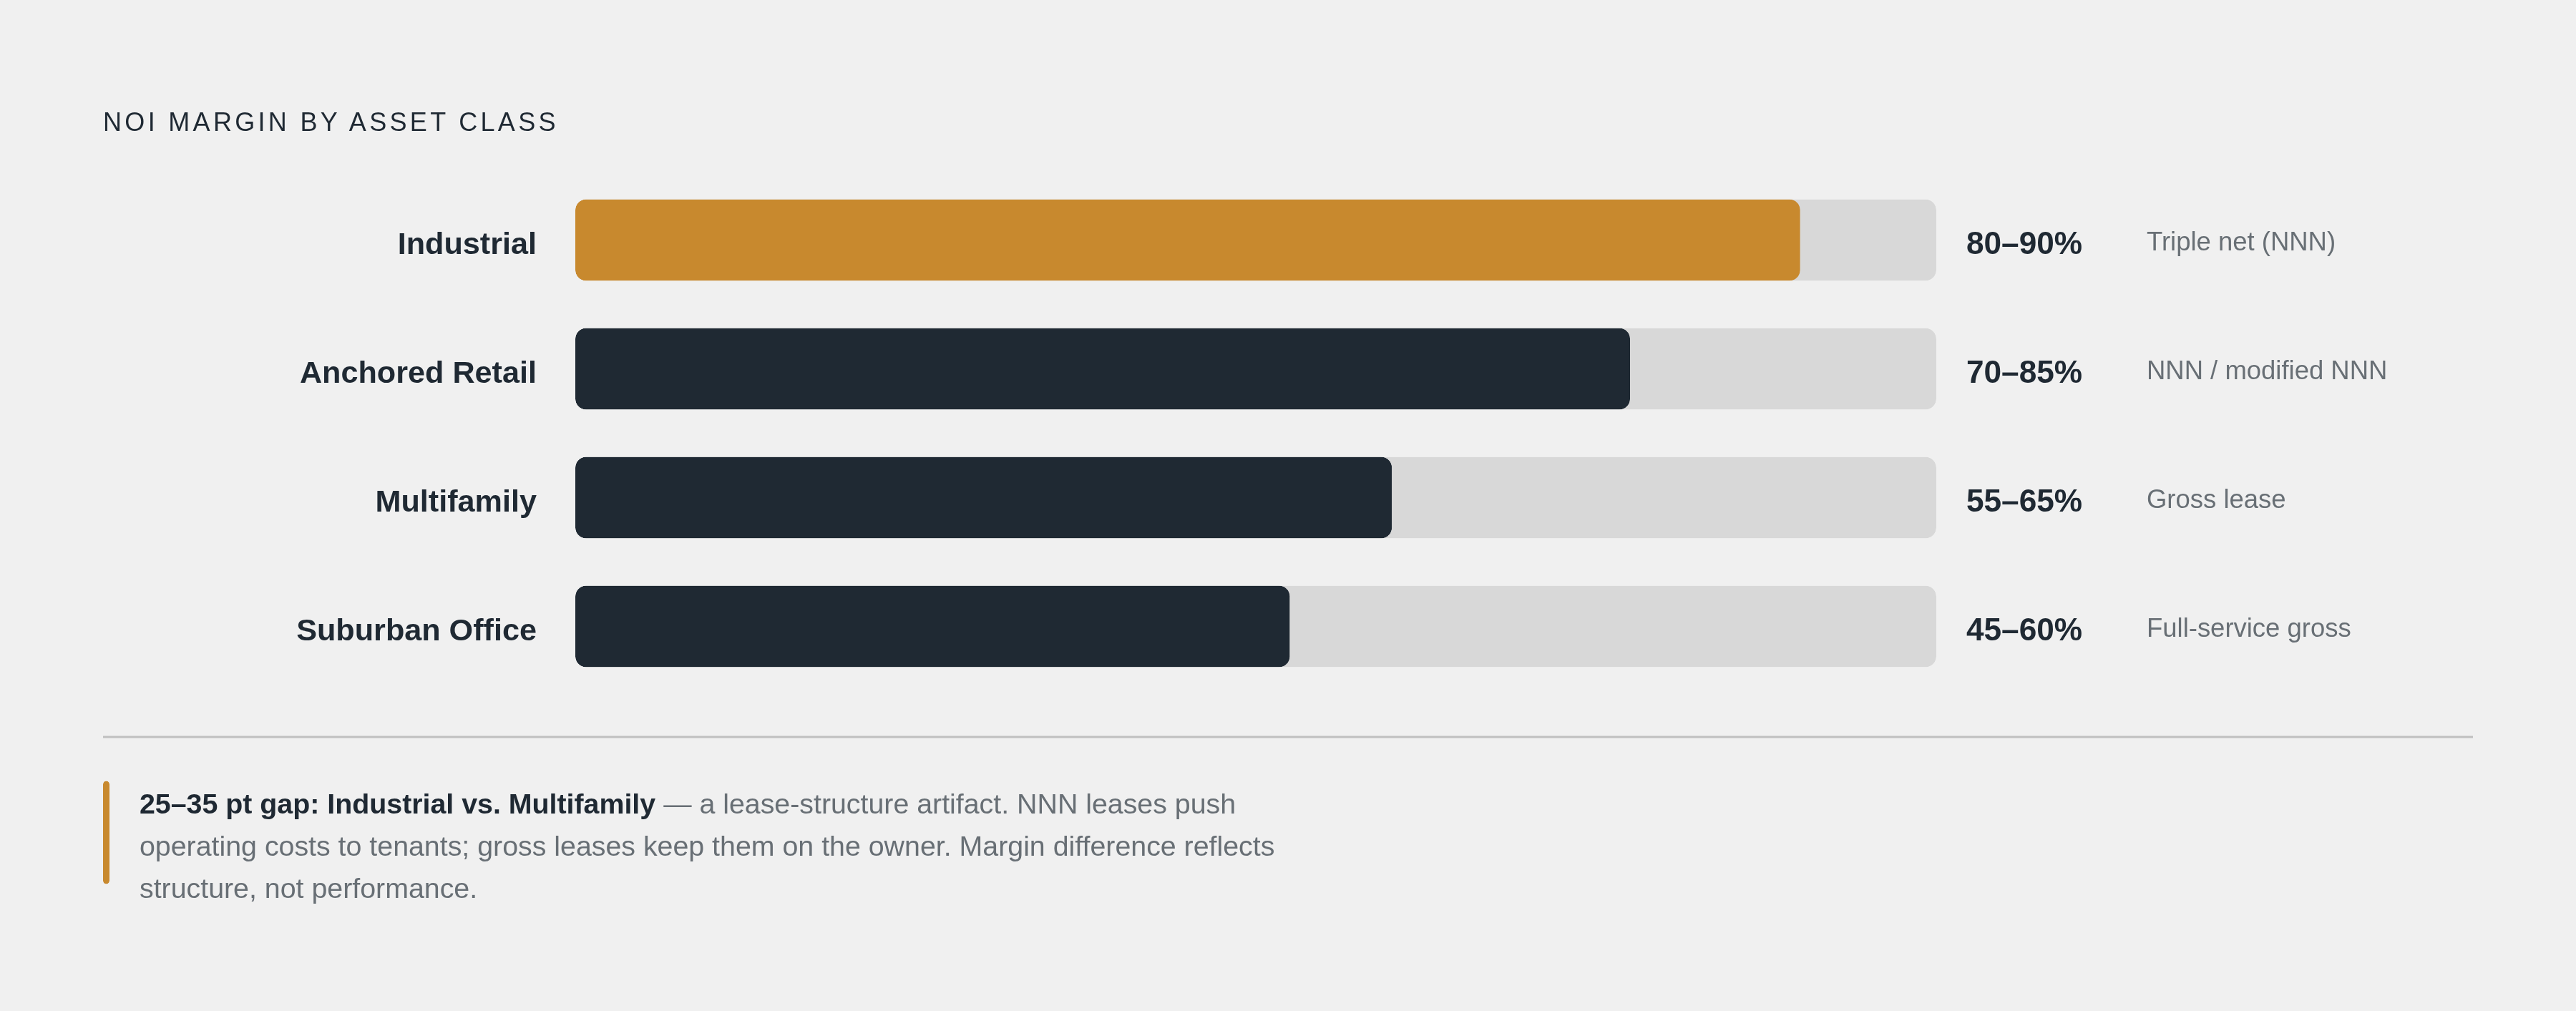
Before discussing any specific asset class, there is one structural variable that explains more of the NOI variation across property types than any other: the lease.
The distinction between a triple-net lease and a full-service gross lease is not merely a legal arrangement between landlord and tenant. It is a determinant of what appears on each side of the operating expense line, and therefore what NOI actually measures. Under a NNN lease, the tenant pays base rent and also covers property taxes, insurance, and maintenance. The landlord books a narrow, clean income stream with minimal operating expenses above the NOI line. Under a full-service gross lease, the landlord absorbs all operating costs and NOI is whatever survives after a much larger expense load. Modified gross leases sit somewhere in between, with no standardized definition, which is precisely why they generate the most reconciliation disputes.
To understand why this matters, consider two hypothetical buildings each generating $120,000 in annual rent. Under NNN, one produces $112,000 in NOI. Under full-service gross, the other produces $85,000, after absorbing the expense load the tenant would otherwise carry. Same rent. Very different NOI. Nothing about either building's operational quality explains that difference. The lease structure explains it entirely.
Expense reimbursements follow directly from this. In office, retail, and industrial, tenants reimburse landlords for taxes, utilities, insurance, and other costs. Those reimbursements appear as income above the NOI line and offset the corresponding expense items. Multifamily has no equivalent; the landlord absorbs all operating costs within the gross lease structure and factors them into the rent. That difference makes cross-asset NOI margin comparisons inherently treacherous.
Industrial NNN margins run approximately 80 to 90 percent. Multifamily gross-lease margins typically run 55 to 65 percent. One interpretation of that gap is that industrial assets are better run. They are not. They simply operate under a lease structure that pushes operating costs to the tenant. Quoting margin figures across asset classes without acknowledging this is how otherwise sophisticated analysis becomes quietly misleading.
Where Multifamily NOI Diverges from the Textbook: Concessions, Ancillary Income, and Continuous Rollover
Multifamily's defining analytical quirk is that lease rollover is not an event. It is the operating condition.
In office or retail, lease expirations are discrete shocks, spaced years apart, visible on a rent roll well in advance. In multifamily, with one-year lease terms across hundreds of units, rollover resets continuously. Every month brings lease renewals, new leases, vacant units, and turnover costs. The operational exposure that other asset classes manage episodically, multifamily manages perpetually.
That continuous rollover makes concession treatment more consequential, particularly in oversupplied markets where concession activity became elevated through 2024 and into 2025. Concessions reduce effective rent. The problem is that they are sometimes buried inside gross revenue figures on proforma underwriting, which makes in-place cash flow look stronger than it is. Identifying this requires line-by-line reconciliation against trailing financials, not a proforma review alone.
Ancillary income adds another layer of complexity. Revenue from pet rent, RUBS (Ratio Utility Billing System), package locker fees, and parking has grown from a historically modest share of total revenue to somewhere between eight and twelve percent as of 2026. That is not trivial. It also is more volatile and more market-specific than base rent, which means proforma assumptions for ancillary income deserve independent scrutiny.
The expense side tells a clarifying story. AvalonBay grew same-store revenue 3.4 percent in full-year 2024, but same-store NOI rose only 2.7 percent. MAA saw same-store revenue increase 0.5 percent while same-store NOI fell 1.4 percent. In both cases, expenses outpaced top-line gains. The National Apartment Association reported that average multifamily operating expenses reached $8,657 per unit in 2024. These figures are useful not as universal assumptions but as benchmarks for validating underwriting against trailing actuals, particularly when a proforma's expense load looks suspiciously lean.
The expense categories that appear above the multifamily NOI line, including payroll for leasing and maintenance staff, utilities in common areas and vacant units, marketing, and turnover costs, have no equivalent in a NNN industrial landlord's income statement. That structural difference is worth keeping in mind whenever multifamily NOI margins are quoted alongside margins from other asset types.
Replacement reserves remain a persistent source of divergence. NCREIF convention places them below the NOI line. Lenders often move them above the line for DSCR purposes. Depending on which convention a given analysis follows, NOI can shift meaningfully without any change to the underlying property.
Office NOI: Why the Expense Load Is Only Part of the Problem and Lease Rollover Is the Other
Office is, at the moment, the most complicated asset class to underwrite with confidence. That complication comes from two sources that compound each other: a heavy expense load and concentrated lease rollover.
Office leases typically run five to ten years. When a large tenant expires, the impact on NOI and debt-service coverage can materialize in a single quarter, not distributed across many small events the way multifamily rollover is. A property that looks fully stabilized on a trailing basis can show a dramatically different forward NOI once one material lease expiration is accounted for. The rent roll's expiration schedule is, in this context, as important as the trailing financials.
Class A office under full-service gross leases means the landlord absorbs all operating costs. NOI margins for suburban office benchmark to 45 to 60 percent, the widest variance of any traditional asset class. That range reflects the spectrum from well-occupied, well-run assets to distressed properties with meaningful vacancy and declining effective rents.
Multi-tenant office under modified gross leases introduces additional complexity through base year stops, expense caps, and gross-up provisions. Each lease requires individual review to understand how much of the operating expense load the landlord actually retains above the line. A line-item comparison of opex between two office assets is largely meaningless without first understanding the reimbursement mechanics embedded in each lease.
It is also worth considering what sits below the office NOI line, because ignoring it produces a dangerously incomplete picture. Tenant improvements in office typically run $40 to $80 per square foot, and leasing commissions commonly run four to six percent of the rent stream. On a single large lease, those costs can absorb multiple years of NOI. Unlevered cash yield after tenant improvements and leasing costs is a more complete performance measure than NOI alone for office acquisitions, even though it sits below the standardized NOI line. Reporting NOI without flagging this below-the-line burden, particularly in a cross-asset comparison, is technically correct and practically misleading.
Industrial NOI: The Cleaner Margin and What Makes It Structurally Different from Cleaner Management
Industrial is the asset class where the NOI calculation most closely resembles the textbook version, and the reasons for that simplicity are worth understanding precisely.
NNN is the standard structure for industrial and warehouse properties. The tenant carries property taxes, insurance, and maintenance. The landlord's operating expense line is thin: property management, structural reserves, minimal common-area costs. The income side is correspondingly clean. Per CBRE, industrial captured 64 percent of all net lease investment volume in 2024, meaning the NNN structure is not a specialty convention but the dominant form in the sector.
The result is the 80 to 90 percent NOI margin benchmark. But as emphasized earlier, that margin does not indicate superior operations. It indicates that operating cost responsibility sits with the tenant. An industrial landlord facing rising insurance rates, higher property taxes, and increasing utility costs watches those expenses appear on the tenant's income statement, not on the NOI waterfall. That is the inflationary insulation that distinguishes industrial NOI stability from multifamily or gross-lease office, where those cost increases flow directly through to margin compression. Industrial NOI is a clean number — but clean like a window, not like a swimming pool: the clarity is structural, not earned.
Where industrial NOI does get genuinely complicated is in rent roll dynamics. Above-market in-place leases rolling to market in a repricing cycle can produce NOI that looks stable today but is structurally impaired forward. Rent bumps, whether fixed in percentage terms or linked to CPI, affect the NOI growth trajectory materially and should be modeled explicitly rather than assumed flat. An industrial proforma that applies a static rent growth assumption without reviewing the in-place lease schedules is not a conservative model; it is an incomplete one.
Retail NOI: Percentage Rent and the Income Line That Varies with Tenant Sales
Anchored retail typically operates under NNN or modified NNN structures, with NOI margins in the 70 to 85 percent range for similar reasons as industrial: the tenant carries most of the operating cost load. CAM, insurance, and taxes pass through, and CAM reconciliation disputes between landlord and tenant are a routine source of income-line adjustments, particularly in centers where tenants scrutinize expense allocations carefully.
The feature that distinguishes retail NOI from every other asset class is percentage rent.
Under a percentage rent provision, the tenant pays base rent plus a percentage of gross sales above a negotiated breakpoint. The structure is most common in shopping centers, outlet malls, entertainment venues, and restaurant-anchored properties. It aligns landlord and tenant interests in a way no other lease structure does: the landlord participates in the tenant's upside. The cost of that alignment is volatility on the income line.
A weak retail sales year compresses percentage rent income without affecting base rent. A strong year adds income that may not repeat. That variability means trailing twelve-month NOI for a retail property with meaningful percentage rent exposure is a poor proxy for forward NOI without understanding the underlying tenant sales trend. It is also worth considering whether the trailing period reflects a seasonally or cyclically unusual performance, which would further limit its predictive value.
Proforma NOI for retail, done properly, treats base rent and percentage rent as separate line items with separate assumptions. Base rent is contractual; percentage rent is a function of tenant sales performance. Blending them into a single revenue line without disclosure makes the income stream appear more predictable than it is, which in turn makes the asset appear less risky than it is.
The broader point that retail NOI illustrates, and that runs through every asset class covered here, is that the formula is not where the analytical work happens. The formula is where it ends. The work happens in understanding what fills each line, which conventions govern those choices, and whether the conventions applied to one asset are compatible with the conventions applied to another before any comparison is drawn.
That is not a trivial observation. It is, in practice, the difference between a cross-portfolio analysis you can defend and one that collapses under a direct question in a deal review. The formula is the same for everyone. The discipline is knowing what it actually measures.