Predictive Analytics for CRE Market Forecasting
Predictive models replace stale reports with real-time scenario analysis.

There is something almost comedic about how commercial real estate forecasting worked for most of its institutional history. A lender or investor would commission an analysis, analysts would gather broker surveys and trailing comps, reconcile figures across four different spreadsheets, and produce a polished report describing, in meticulous detail, a market that no longer existed. The report would land on a decision-maker's desk six to eight weeks after the most relevant data had been generated. By then, the acquisition window had moved. The risk had compounded. The refinancing opportunity had narrowed. And everyone involved would do it again next quarter.
This is not an indictment of the people. It is an indictment of the process.
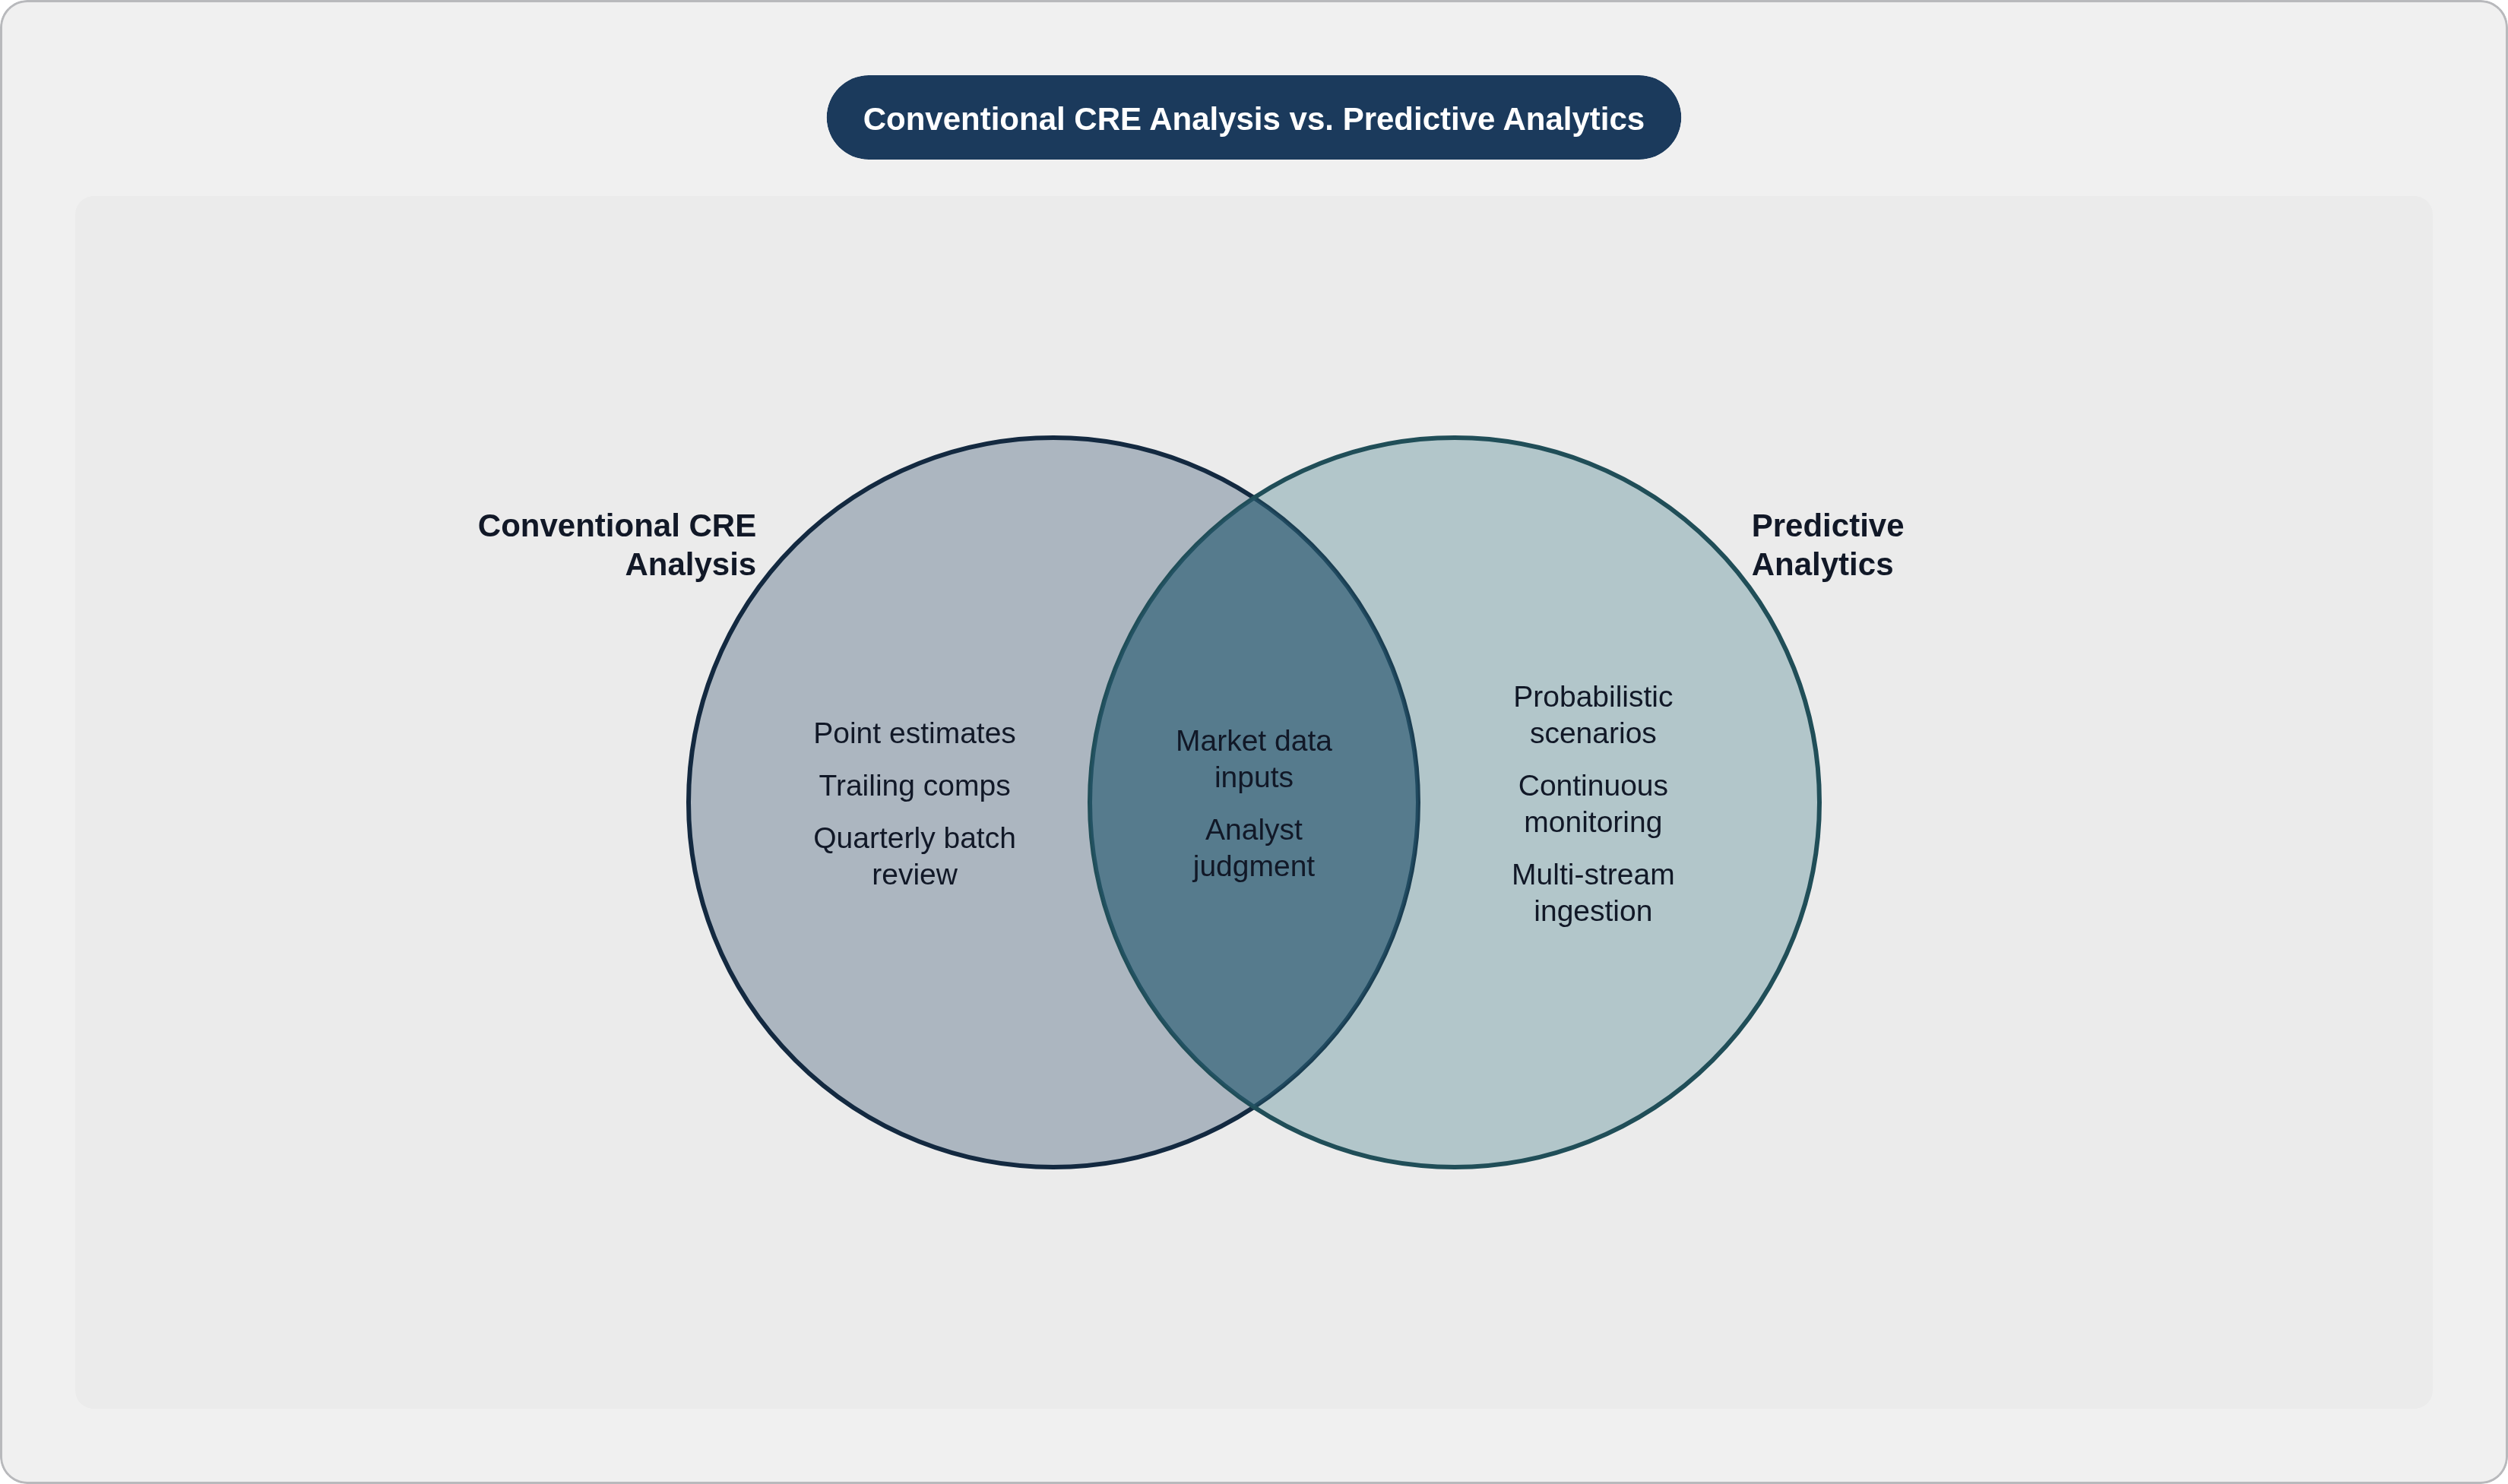
To understand why predictive analytics represents a genuine departure rather than an incremental improvement, you have to look at how each approach generates knowledge, not just how fast it does it. Conventional CRE analysis follows a recognizable logic: select a dataset, apply assumptions derived from experience and comparable transactions, produce a point estimate. A cap rate. A projected vacancy rate. A rent growth figure. The output feels precise because it is singular. It also tends to be wrong in specific, predictable ways, because it treats the market as a system whose future state can be inferred from a curated slice of its past.
Predictive analytics ingests many data streams continuously, surfaces probabilistic patterns across them, and updates as new signals arrive. The output is not a point estimate but a range of scenarios weighted by likelihood. That is a different epistemological posture, not a faster version of the old process.
The core techniques now in active institutional use include regression analysis modeling relationships between property characteristics and outcomes; time series analysis identifying trajectory patterns in historical absorption and pricing data; machine learning detecting non-linear relationships across many variables simultaneously; natural language processing extracting signals from lease documents, earnings calls, and regulatory filings; and geographic information systems layering spatial data onto both market and asset-level models. None of these are new in isolation. What is new is their integration, and their application to the specific document structures, lease conventions, and market dynamics that define CRE.
That raises an important question: if the techniques are not new, why did it take so long? The data pipelines did not exist. Models are only as useful as the inputs feeding them, and CRE data was historically fragmented across property management systems, lender files, broker networks, and public records with no standardized taxonomy connecting them. Sophisticated modeling on top of incoherent inputs produces confident-sounding but unreliable outputs. The integration problem had to be solved before the modeling problem became worth solving.
How vacancy trend modeling and rent trajectory analysis work in practice
Vacancy trend modeling in its conventional form is a look-back exercise. Occupancy at period end, compared to occupancy at prior period end, expressed as a percentage. Useful for regulatory reporting. Not particularly useful for anticipating what happens next.
Predictive vacancy modeling works from a different set of inputs: current occupancy rates, lease expiration schedules, tenant financial health signals, submarket absorption trends, competing supply under construction. The output is not a single vacancy figure but a probability distribution across scenarios. Not "vacancy will be 14% in 18 months" but "there is a meaningful probability of vacancy exceeding 18% if two anchor tenants whose credit signals are deteriorating exit and pipeline supply in this submarket delivers on schedule." That distinction transforms how a lender or investor can actually use the information.
What this enables practically: lease renewal strategy calibrated to realistic rollover scenarios; reserve planning tied to projected rather than historical performance; capital improvement timing that anticipates tenant departure rather than responds to it. The early-warning application is particularly valuable for lenders. If a tenant's financial signals suggest elevated default or exit risk, the model surfaces that before formal notice arrives, before a covenant is breached, before the loss is realized.
Rent trajectory analysis operates in parallel, drawing on historical rent growth by submarket, new supply in the pipeline, employment trends in anchor sectors, and indexed lease comps over time. At acquisition, this tests whether a deal's underwritten rent growth assumptions are consistent with where the model places the submarket. At disposition, it identifies the window before rent growth peaks and cap rate expansion begins compressing value.
The two capabilities interact in ways that matter. A submarket with falling vacancy and constrained supply signals rent upside. A model integrating both trajectories provides a richer picture than either in isolation; the interaction is where the analytical leverage lives.
One observation worth making: experienced analysts have long synthesized these signals intuitively, and that argument should not be dismissed. But intuition scales poorly across a portfolio of several hundred assets. Models do not get tired or anchored on last quarter's thesis.
Where the models genuinely fall short deserves equal acknowledgment. Exogenous shocks — a major tenant bankruptcy, a rapid regulatory change, an unexpected rate move — can outrun historical pattern-matching. The analyst's role in a well-designed implementation is precisely this: stress-testing model outputs against scenarios the data has not yet seen. The model handles pattern recognition. The analyst handles the imagination.
From individual assets to portfolio-wide opportunity surfacing
Manual asset review is sequential by nature. A team can only scrutinize so many positions deeply in any given quarter. A portfolio of several hundred commercial loans means most positions, most of the time, receive less attention than they warrant. Risks accumulate in the unreviewed positions. Opportunities expire before they surface to anyone's attention.
Portfolio-level predictive analytics changes the structural logic. Rather than directing analysts to assets sequentially, automated monitoring reviews every position continuously and surfaces the ones that require human attention: loans approaching maturity mapped against current rate environments and property performance trends; assets with multiple lease expirations clustering in the same window, creating correlated vacancy risk that a position-by-position view obscures; assets whose trajectory, not merely current net operating income, suggests disposition outperforms continued hold.
For CRE lenders specifically, this translates into composite loan health scores aggregating debt service coverage ratio trends, vacancy movement, tenant credit signals, and market conditions into a single continuously updated indicator per loan. Risk-tiered monitoring means analytical resources flow toward positions that need scrutiny rather than being distributed uniformly across the book.
That grounding in firm-specific context matters for the reasons explored in a moment.
The structural implication is worth noting. Institutions that monitor their full portfolio continuously are positioned to act on opportunity more quickly and detect risk earlier than those still running quarterly point-in-time reviews. They are operating in a different information regime.
Covenant monitoring and early risk detection as a forecasting discipline
Here is where most lenders, including sophisticated ones, have left significant value on the table. Covenant monitoring has historically been understood as a backward-looking confirmatory exercise: did the borrower meet the threshold at the measurement date? That framing treats it as an accounting function. It is, in fact, a leading indicator system, but only if the data feeding it is current and the monitoring is continuous.
Consider the scale of the problem at a mid-sized lender. A portfolio of several hundred active commercial loans carries thousands of individual covenant thresholds to track each quarter. A large share of lenders still manage this through spreadsheets and manual extraction. That process is slow, error-prone, and structurally backward-looking: by the time the data is assembled, the condition it describes is already historical.
AI-automated covenant monitoring changes several things simultaneously. Natural language processing extracts covenant terms directly from loan documents, including amendments and side letters, without manual rekeying. Continuous mapping of borrower financial data against extracted thresholds updates as new financials arrive rather than in quarterly batch. Proactive alerting as headroom narrows gives lenders time to engage borrowers before a technical breach. Some implementations have reported reductions in operational hours required for covenant review, freeing credit staff for analysis rather than data assembly, though results vary by firm and deployment.
The early-warning value is the real point. Detecting a deteriorating debt service coverage ratio trend six months before a covenant breach gives a lender options largely unavailable after the breach is reported: loan modification, additional reserves, accelerated exit. After the breach, those are negotiations under duress. Before it, they are portfolio management.
It is also worth noting what automated covenant monitoring does not do: it does not transfer institutional responsibility. The lender retains ownership of the monitoring posture, override authority, and documentation obligations. The technology compresses the time between signal and decision. The obligation to decide remains with the institution.
Within this framework, automated extraction and threshold mapping grounded in the lender's own loan templates mean every alert carries source citations, so the basis for a flag is traceable rather than opaque. That traceability is not a nice-to-have; it is what makes the output defensible in a credit committee or regulatory examination.
Financial spreading as the upstream input that forecasting models depend on
Predictive analytics for vacancy trends, rent trajectories, and portfolio risk depends entirely on accurate, normalized, period-consistent financial data per asset. If borrower financials arrive as scanned PDFs, mixed Excel formats, and handwritten tax returns, and are rekeyed manually into a spreading template, the data entering the forecasting model carries analyst error, inconsistent line-item classification, and lag. Sophisticated modeling on top of that input does not compensate for the underlying noise. It amplifies it.
Why exactly does this happen? Because manual spreading is not just slow; it is inconsistently subjective. Two analysts spreading the same operating statement will classify certain line items differently, handle partial-year periods differently, treat anomalous entries differently. When those outputs feed a portfolio-level model, the inconsistencies introduce noise that looks like signal.
AI financial spreading addresses this at the source. It reads financial statements, tax returns, rent rolls, and bank statements across formats simultaneously, classifies line items against standardized taxonomies, reconciles across periods, flags anomalies, and surfaces discrepancies before an analyst touches the output. Multi-document reasoning builds a consolidated financial picture across multiple schedules and K-1s, with citations back to source documents. Some lenders adopting AI-assisted spreading have reported the ability to process more transactions with the same analytical team, with time-per-statement dropping meaningfully per document, though reported results vary across implementations.
The capacity implication for forecasting is direct. Faster, cleaner spreading means portfolio-level models can be fed more current data more frequently. The lag between a borrower submitting financials and that data informing a risk or opportunity signal compresses substantially.
The distinction from general-purpose AI tools is material. A model not trained on CRE document structures may misclassify line items and misalign periods in ways that propagate silently into downstream analysis. The errors are invisible until someone tries to audit them.
What separates institutions that use predictive analytics well from those that buy it and underuse it
Adoption has accelerated. According to JLL's research, a large majority of institutional investors now report using AI for market analysis, up from a small minority just a few years prior. That figure gets cited as evidence of an industry transformation. It is also, if you look at implementation quality, evidence of something more complicated.
The most common failure mode is using predictive tools on top of fragmented, inconsistent underlying data. Models trained on incomplete or poorly structured inputs produce outputs with false precision. They look credible. They generate charts. The charts describe noise. Analysts who cannot interrogate or audit a model's data sources cannot know when to trust it, and so they either trust it uncritically or dismiss it entirely. Neither is useful.
A second failure mode: treating model outputs as decisions rather than inputs to decisions. Vacancy probability distributions and rent trajectory curves are scenario tools. They inform underwriting assumptions. They do not replace credit judgment, and institutions that conflate the two remove the human layer that catches what the model has not been trained to see. Every financial services firm I have spoken with that went too far down the automation path eventually had to rebuild the analyst review layer after a model-driven misjudgment surfaced in a portfolio review.
General-purpose AI tools compound both problems. Not trained on CRE document structures, not connected to the firm's own templates and institutional knowledge, they produce outputs analysts cannot ground in firm-specific context. The analyst is asked to trust an output they cannot trace. Most sensible analysts, correctly, do not.
Effective implementations share identifiable characteristics. Data pipelines are standardized before models are layered on. The AI is grounded in the firm's own institutional knowledge: its underwriting templates, its covenant language, its historical deal data. Human-in-the-loop design means automation handles extraction, normalization, and pattern detection, while analysts own interpretation, stress-testing, and final judgment. Every AI output carries source citations, so a risk flag or opportunity signal can be traced back to the document and data point that generated it.
The gap between institutions that have built this infrastructure and those still evaluating it is widening. Speed and portfolio coverage advantages compound over time.
How to assess whether a predictive analytics platform is built for CRE or adapted to it
The distinction that matters is not features. It is whether the platform was built for CRE or adapted to it.
CRE documents — rent rolls, operating statements, loan agreements, lease abstracts — carry structures, conventions, and edge cases that general-purpose models are not trained to handle reliably. A platform built by people who have actually closed CRE transactions encodes the workflow logic, not just the data extraction. That difference does not show up in the demo. It shows up in the third month of use, when an amended lease with non-standard covenant language needs to be processed, or when a rent roll with multiple tenant structures needs to be reconciled against a tax return.
Several questions cut through the marketing quickly. Does the platform extract and monitor covenants using the firm's own loan document templates, or does it impose a generic taxonomy? Does financial spreading produce source-cited outputs, and can an analyst trace every line item back to its source document? Does portfolio monitoring surface opportunities and risks across the full loan book continuously, or does it require analyst-initiated queries? And where does the firm's own institutional data — its historical deals, its underwriting IP, its covenant language — live within the model?
These are not abstract questions. They are the difference between a platform that becomes embedded in the firm's decision-making infrastructure and one that gets used for a few months and quietly deprioritized.
But what if the technology is right and the implementation is wrong? That is actually the more common scenario. The institutions extracting durable competitive advantage from predictive analytics are not necessarily the ones with the most sophisticated models. They are the ones that treated data standardization as a prerequisite, grounded the AI in their own institutional context, and preserved human judgment at the interpretation layer.
The market will continue to move faster than quarterly reports can capture. That is not a forecast; it is a description of how CRE markets have always worked, now accelerated. The forecasting infrastructure that serves institutional investors and lenders well in that environment is not the one that describes the past most precisely. It is the one that narrows the gap between when a signal emerges and when a decision gets made.